
Forward: Building 3D models of select Death Valley outcrops in the Mormon Point Area from hand-held photos
Intent of this book: Software has become robust enough one can make detailed, oriented, scaled and positioned 3D models of outcrops and landscape features. Such models aid scientific analysis, allowing for quantification, and can also be easily shared with others. The purpose of this document is to provide the photos and context information for 7 sites/outcrops from Death with which one canconstruct such outcrop models. Specifically it provides suites of photos taken from different positions and at constant focal length of a target outcrop along with context information. Each chapter in this book provides those components for an individual outcrop.
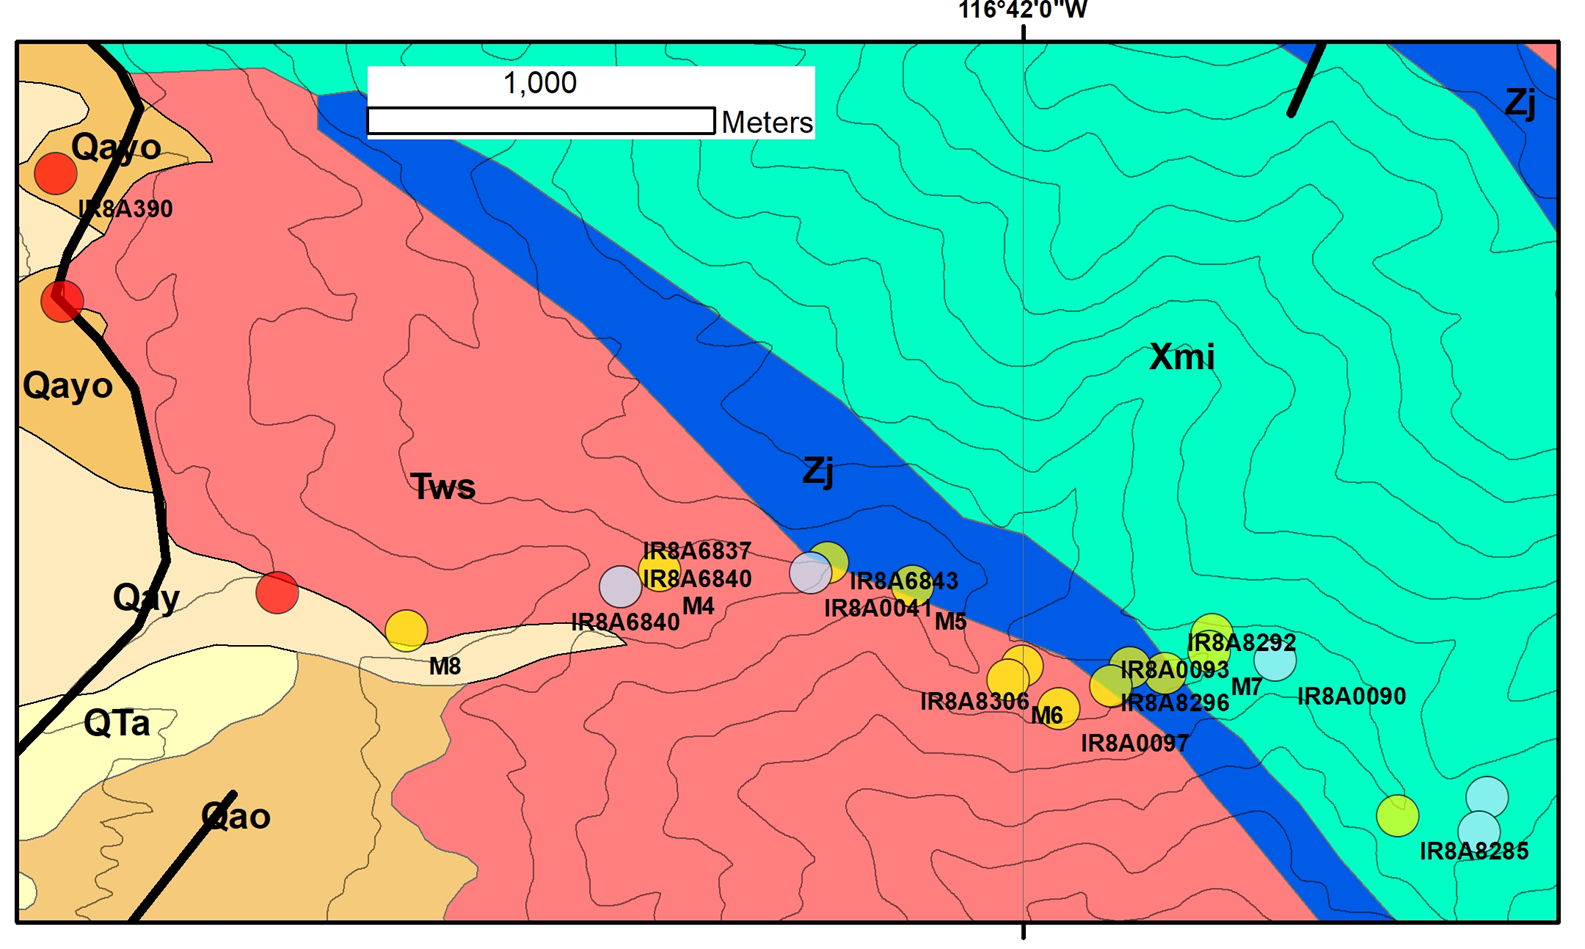
Geologic context: The 7 examples are from outcrops in the footwall beneath a large fault in the southern Black Mountains of Death Valley, with the first 5 from a transect up Sheep Canyon. Sizemore et al. (2019) provides a recent overview of the tectonics of this area, and Miller and Pavlis (2005) provide an oft-cited earlier review. Burchfiel et al. (1995) provide geologic background more focused on the Mormon Point area. There is significant debate in the literature as to the tectonics of this area. These outcrops display an array of foliations, opening and shear mode fractures, and intrusive contacts that can be analyzed for timing relationships, fracture preferred orientations, fracture density, fracture truncations, and fracture network patterns. Depending on what software is being used, some traces of surfaces in the 3D model can permit determination of strike and dip. Models have been successfully constructed for each of these image suites. The photo suites and context information provided here can then be used to design specific exercises that allow : 1) teaching of the mechanics of making 3D outcrop models, 2) possible ways to analyze such models, and 3) exploration of the phenomenon of cataclastic strain as exhibited in these rocks (Maher et al., in revision).
Drone versus hand-held photos: For larger areas or outcrops drone photos are used for 3D model construction. Drone photos are typically automatically geotagged with GPS, view inclination and direction, and focal length embedded in the image file. 3D modeling software can read that information and build geo-rectified models (scaled and positioned wrt to latitude and longitude or UTM). However, drones are not permitted in some cases (e.g. in National Parks) or are not practical. In our experience carefully taken hand-held cameras can produce high quality models with a resolution in the mms range. Some hand-held cameras also geotag, but experience indicates that at a smaller scale of meters to several tens of meters the error associated with the geotagging is relatively large enough to the scale of the target that the resulting models are not properly oriented or scaled and can be significantly distorted. In this case, if one places a scaled feature with 3 distinct points of known position on the outcrop, then in the photo one can identify those as tie points in the 3D modeling software, and this will serve to scale and position the resulting points that make up the resulting 3D model. This is the approach taken for the first 5 models. The positions of the tie points are given in the context information provided with each photo suite. Nesbit et al. (2020) provide a recent review of the literature and example of the use of digital models in geologic analysis.
Software needed: You will need to have access to one of several software packages exist that allow the construction of 3D models from photo suites. We use Agisoft’s Photomodeler. When selecting for the highest resolution models the processing time for the photo suites provided here can be in excess of several hours with a higher end computer. Considering what type of resolution you need for analysis is therefore important.
Relative versus absolute positions: A folding ruler with two segments at right angles as placed in front or on the outcrop, and the length and orientation of each segment was measured. Most of the time the bottom segment was oriented horizontally. From the lengths and orientations the position of the intersection and two end points was calculated and these were used as tie points in the images during 3D model construction. The site Excel files provide the three tie point positions relatively, where tie point 1 is the origin, and the position values are 0, 0, 0 and tie points 2 and 3 are relative to that, with x to the East, y to the north, and z upwards.
In addition, the UTM values for tie point 1 are also given. These were determined in the field with a hand-held GPS device, except for elevation which was obtained from Google Earth. The large errors associated with GPS elevation determinations led to using Google Earth as the elevation source. My adding the relative positions to the UTM values one can position the model in geographic space. The relative point accuracy for the models we created is judged to be in the cms range. The absolute position accuracy relative to a UTM framework is at the least the several meters typical of hand-held GPS readings. Most analysis depends on the relative position accuracy. One can use the ruler in the images to determine model accuracy. Whether one uses the relative or geographic positions to build the 3D model is up to how the model will be used or analyzed.
For the DryWaterfallCanyon and Scotty Canyon site as an experiment the photos were geotagged and because of time considerations and as an experiment a scale providing three tie points was not included when the photos were taken. Because of the GPS error in the photo geotagging our resulting models were misoriented and scaled improperly. However, to the eye some did not appear distorted and so still allow for qualitative evaluation of geologic relationships. We suspect that with some effort and trial and error a more accurately oriented and scaled model could be made and for those who wish to gain more experience in building 3D models can attempt to do so.
Chapters/sites:
- Site 4, Sheep Canyon
- Site 5, Sheep Canyon
- Site 6, Sheep Canyon
- Site 7, Sheep Canyon
- Site 8, Sheep Canyon
- Dry Waterfall Canyon site
- Scotty Canyon site
References:
- Burchfiel, B.C., Molnar, P., Zhang, P., Deng, Q., Zhang, W., and Wang, Y., 1995, Example of a supradetachment basin within a pull-apart tectonic setting: Mormon Point, Death Valley, California; Basin Research, v. 7, p. 199 214.
- Maher, H. D., Johnson, A. J., Braathen, A. and Osmundsen P. T., in revision, Cataclastic Strain in Footwall Rocks of the Mormon Point Turtleback, Death Valley; Lithosphere
- Miller, M.B., and Pavlis, T.L., 2005, The Black Mountains turtlebacks: Rosetta stones of Death Valley tectonics; Earth Science Reviews, v.73, p.115–138, https://doi.org/10.1016/j .earscirev.2005.04 .007
- Nesbit, Paul Ryan et al., 2020, “Visualization and Sharing of 3D Digital Outcrop Models to Promote Open Science.” GSA Today, v. 30, p. 4-10, https://www.geosociety.org/GSA/GSA/GSAToday/science/G425A/article.aspx
- Sizemore, T., Wielicki, M. W., Çemen, I., Stockli, D., Heizler, M. & Robinson, D., 2019, Structural evolution of central Death Valley, California, using new thermochronometry of the Badwater turtleback. Lithosphere, v. 11 (4), p. 436–447. doi: https://doi.org/10.1130/L1044.1
- Workman, J. B., Menges, C. M., Page, W. R., Taylor, E. M., Bartlett Ekren, E., Rowley, P. D., Dixon, G. L., Thompson, R. A. and Wright, L. A., 2002, Geologic Map of the Death Valley ground-water model area, Nevada and California; USGS Miscellaneous Field Studies MF-2381-A
