
8 Experiment 2: Measurements and Significant Figures
Jennifer Kopanic
Background
There are tools that we use in our daily life to measure various matter; these include measuring cups, bathroom scale, and a thermostat. In the lab, we also have tools that can be used to measure a variety of physical properties. These include thermometers, electronic balances, graduated cylinders, volumetric flasks, pipers, and rulers.
In this experiment, you will measure the physical properties of substances using different methods and will determine the uncertainty and related statistics of those measurements. Another concept that is addressed in this experiment is the limitation of each tool and significant figures. Each tool has a value that can be reported with certainty and a value that can be reported with uncertainty. For example, a 10-mL graduated cylinder reports to the tenths digit. Therefore, you would only estimate the hundredths digit. The uncertain digit is the last digit recorded. The uncertain digit is a significant figure, but its exact value is estimated. In order for laboratory measurements to be valid, they need to be reproducible.
What is a "significant figure" (also known as sig fig)?
Simply put, significant figures in a number is the number of figures that are known with some degree of reliability. For example, the number 12.7 has 3 significant figures. The number 12.20 has 4 significant figures.
To determine the number of significant figures in a number, use the following four rules:
- Non-zero digits are always considered significant.
- Any zeros between two significant digits are also considered significant.
- A zero at the beginning of a number is not significant.
- A final zero or trailing zeros in a number with decimals are significant.
Examples:- 0.70 has two significant figures
- .632 has three significant figures
- 0.004 has one significant figure
- 1.5 has two significant figures
For addition/subtraction, use the following rules:
- Count the number of significant figures in the decimal portion of each number in the problem.
- Add or subtract the numbers as you normally would.
- Adjust your final answer to have the same number significant figures to the right of the decimal than the number with the LEAST number of significant figures in the problem.
Examples:- 1.2 + 3.4 = 4.6
- 5.7 - 4.22 = 1.5
For multiplication/division, use the following rule:
The LEAST number of significant figures in any number in the problem determines the number of significant figures to be used in the answer. (Need to look at the entire number, not just the decimal portion)
*This means you have to be able to recognize significant figures in order to use this rule*
Example:
-
- 5.26 x 6.111 = 34.2
- 5.26 has 3 significant figures
- 6.111 has 4 significant figures
Determining the correct number of significant figures to use for any measurement depends on the tool you're using. When you record measurements for an electronic scale or digital thermometer, every digit displayed is recorded and a significant figure. However, the last digit displayed is the uncertain digit. Measurements from electronic devices are the simplest to record because you simply write down all of the digits that are displayed on the device.
When it comes to analog devices, such as a graduated cylinder or a ruler, determining and recording the correct number of significant figures requires some thought. The scales on rulers and graduated cylinders have graduations (tick marks) that are numbered and graduations that are in between the numbered values that are not numbered. Both the numbered and unnumbered graduations are certain digits. One must first determine the value of the digit on the unnumbered graduation. Then, the value of the uncertain (or estimated) digit can be determined. The uncertain digit is one digit smaller than the digit of the unnumbered graduation. For example, if the unnumbered graduation of a ruler is the tenths place, the estimated (uncertain) digit is the hundredths place.
Throughout this semester, you will be expected to record measurements with the correct number of significant figures. When you will calculate values, you will express the final answer with the correct number of sig figs and units. The final answer cannot be more precise (have more decimal places) than the measurements that were used to calculate the answer.
All measurements that are properly recorded have units. Units correlate with a physical property that can be measured (e.g., temperature, length, mass, or volume). If you grew up in the U.S., you are familiar with the Imperial System of measurements. However, scientists around the world (including those in the U.S.) use the International System of Units, which is known by the international abbreviation of SI or the SI system, as the system of measurement. Students are in the laboratory will be using the SI system for all measurements, so it is important for you to become familiar with the metric system and the physical properties associated with each type of measurement. Every measurement that you record must have a unit to be considered valid.
Precision Vs. Accuracy
We use statistics to help determine how precise or accurate a set of measurements are. Precision relates to how close measurements are to each another. Precision can also relate to the number of significant figures after a decimal point on a measuring device.
Accuracy relates to how close measurements are to an accepted value. Accepted values in chemistry are known as literature values; these values have been accepted by experts.
As shown below, measurements can be:
- Neither precise nor accurate (SF Fig. 1.5 A).
- Precise but not accurate (SF Fig. 1.5 B).
- Accurate but not precise (SF Fig. 1.5 C); the darts are all approximately equal distance from the bullseye, which means that they are mathematically accurate as the average of the darts is in the bullseye.
- Both precise and accurate (SF Fig 1.5 D).
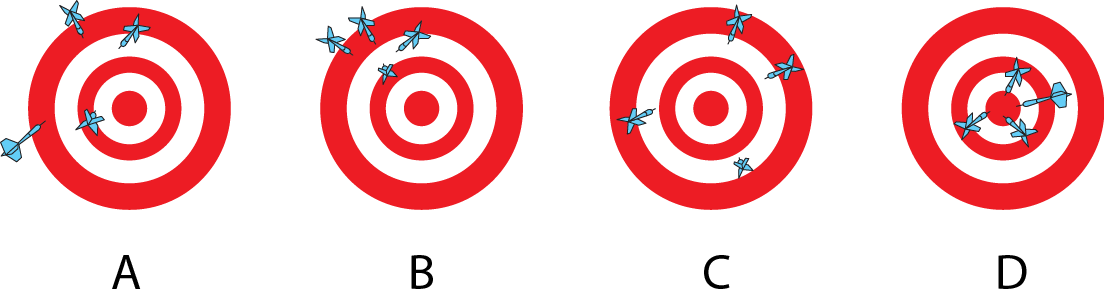
SF Fig. 1.5 Dartboards showing different accuracy and precision scenarios.
In this lab we will determine the mean (also known as the average), range, and standard deviation or percent error for datasets. The mean is the sum of the values in a dataset divided by the number of data points. The range of a dataset is calculated by subtracting the smallest value in the dataset from the largest value in the dataset. Standard deviation is a measure of how precise the set of measurements is or how close the measurements for a given item are. Percent error is a comparative calculation that allows you to compare your experimental results to the known value.
The standard deviation is calculated using the following equation:
http://academics.wellesley.edu/Chemistry/stats/stdeva.gif
http://academics.wellesley.edu/Chemistry/stats/lesson3.html
s = √ (Σ (xi - x̄)2 / (n-1))
s = standard deviation
Σ = summation of the values in parentheses
xi = individual measurement
x̄ = mean or average of the measurements
n = total number of measurements
Deviations for each measurement are determined by subtracting the mean from the measurement. The deviations are then squared, summed, and divided by one less the number of values; then, the square root is taken of that value.
Below is an example in a data table, which includes each step for calculating the standard deviation using 3 different mass measurements (0.922 g, 0.924 g, and 0.921 g):
| Mass of a stirring rod | Mean mass of a stirring rod | Deviation | Deviation squared | Sum of squared deviation | n-1 | Sum of squared deviation divided by (n-1) | Square root of previous value |
| 0.922 g | 0.92233 | -0.00033 | 1.089 × 10⁻⁷ | 4.6667 × 10⁻⁶ | 2 | 2.33335 × 10⁻⁶ | 0.0015 g |
| 0.924 g | 0.92233 | 0.00167 | 2.789 × 10⁻⁶ | ||||
| 0.921 g | 0.92233 | -0.00133 | 1.769 × 10⁻⁶ |
The significant figures for statistics follow different rules than those for measurements. The standard deviation is expressed with two significant figures and the standard deviation has the same units as the measured values. When you express the mean of a dataset, the number of digits after the decimal point is determined by the standard deviation.
Since the calculated standard deviation in the example above has four decimal digits after the decimal point, the mean is expressed with four digits after the decimal point. For this example, the mean and its standard deviation is: 0.9223 ± 0.0015 g.
The other type of statistical calculation in this experiment is percent error. Percent error allows scientists to determine how accurate their experimental results are compared to the true value (or literature value). When thinking about percent error, the smaller your calculated value is, the more accurate (or close to the literature value) it is. To calculate the percent error, take the absolute value of the difference between the accepted (literature) and experimental values divided by the accepted value, multiplied by 100%. As this calculation includes the absolute value, your final answer will always be a positive number.
[latex]\% \: \text{Error} = \frac{\left| \text{experimental value} - \text{accepted value} \right|}{\text{accepted value}} \times 100\%\nonumber[/latex]
As an example, let's calculate the percent error of room temperature water. The literature value of room temperature water is 20.0°C. Let's assume that the measured or experimental value was 19.7°C.
| Experimental value | Accepted value | Absolute value of difference |(accepted value - experimental value)| |
Difference divided by accepted value | Multiplied by 100% |
| 19.7°C | 20.0°C | 0.3°C | 0.015 | 1.5% |
Objective:
This week's lab is an introduction to handling and using common laboratory measuring devices. You will use the common rules and conventions of significant figures when recording measurements and calculating statistical analyses and calculate the standard deviation or percent error for your measurements to be able to evaluate the precision and accuracy of your laboratory measurements.
SAFETY:
In this week's experiment, the are no significant laboratory safety hazards to be aware of. Glassware and measuring devices should be handled with care. Sweep up broken glass should be cleaned up with the brush and dustpan and disposed of in the cardboard box labeled for glass disposal. Inform your instructor if you break glassware.
Mistakes:
You will record your data on a report sheet. Any mistakes should be crossed out with a single line. Do not scribble out or use white-out to obliterate or cover-up any data. All measurements and observations must be recorded in blue or black pen.
Part A Procedure: Length Measurements
Measuring the length of three stirring rods and determining their mean and range values.
- On the report sheet, there is a magnified section of a centimeter ruler with the values of 1 cm and 2 cm labelled.
- Identify and label the value of each unnumbered graduation between 1 and 2 in units of centimeters (not millimeters).
- The unnumbered graduations are the smallest certain values for the centimeter ruler.
- Identify the place value (ones, tenth, hundredth) of the smallest certain digit on the report sheet.
- As a ruler is an analog measuring device, the uncertain digit is estimated. This estimated digit is one place value smaller than the place value of the smallest certain digit.
- Identify the place value of the estimated (uncertain) digit on the report sheet. - Determine the place value of the numbered and unnumbered graduations of your ruler and record these on your report sheet.
- Every measurement you take with the ruler will have the estimated digit in the same place value.
- On the report sheet identify how many places after the decimal point every measurement taken with your ruler will have. - Obtain three glass stirring rods that are approximately the same size.
- Place one of the three glass stirring rods on the report sheet and make a mark with a pen at each outer edge of the curved portion of the stirring rod.
- Remove the stirring rod and measure the distance between the two marks. Remember to estimate the uncertain digit.
- Record this distance as the length of the first stirring rod in Data Table 1.
- Ensure that your length measurement has the correct sig figs, correct number of numbers after the decimal point, and unit. - Repeat this process with the other two stirring rods.
- For each of your recorded measurements, underline the estimated digit.
- Calculate the mean (average) length of the stirring rods by adding the lengths together and dividing by the number of stirring rods (3).
- Show your work on the report sheet. Remember to include units to receive for full credit.
- Record the mean with correct units and sig figs (according to addition and subtraction sig fig rules) in Data Table 1. - Determine the range of the stirring rod lengths
- The range is calculated by subtracting the lowest measured value from the highest measured value.
- Show your work, including units and significant figures (according to the rules of addition and subtraction for sig figs).
- Record your answer on the report sheet in Data Table 1.
Part B Procedure: Volume Measurements
Measuring the volume of water using two different measuring devices.
- A graduated cylinder is also an analog measuring device. On the report sheet there is a magnified section of a 10 mL graduated cylinder with the values of 1 mL and 2 mL labelled.
- Identify and label the value of each unnumbered graduation between 1 mL and 2 mL.
- The unnumbered graduations are the smallest certain values for the 10 mL graduated cylinder.
- Identify the place value of the smallest certain digit on the report sheet.
- Remember that in analog measuring devices, the uncertain digit is estimated. This estimated digit is one place value smaller than that of the smallest certain digit.
- Identify the place value of the estimated (uncertain) digit and record it on your report sheet. - Using your 10-mL graduated cylinder, identify the place value of the unnumbered graduations of your graduated cylinder on the report sheet.
- Every measurement taken with a 10-mL graduated cylinder will have the estimated digit in the same place value.
- Determine how many places after the decimal point every measurement taken with this graduated cylinder will have. Record this on your report sheet. - On the report sheet there is a magnified section of a 100-mL graduated cylinder with the values of 10 mL and 20 mL labelled.
- Identify and label the value of each unnumbered graduation between 10 mL and 20 mL.
- The unnumbered graduations are the smallest certain values for the 100 mL graduated cylinder. Identify the place value of the smallest certain digit on the report sheet.
- Again, your 100-mL graduated cylinder is another analog measuring device. Therefore, the uncertain digit is estimated. This estimated digit is one place value smaller than that of the smallest certain digit.
- Identify the place value of the estimated (uncertain) digit on the report sheet.
- Every measurement you take with a 100-mL graduated cylinder will have the estimated digit in the same place value.
- Identify how many places after the decimal point every measurement taken with your 100-mL graduated cylinder will have. Record this on your report sheet. - When observing a volume of liquid in a graduated cylinder, you will notice that there is a concave curvature of your liquid. This curvature or curved surface of the liquid is called the meniscus. Volume measurements are read a the bottom of the meniscus. To accurately read the meniscus, place the graduated cylinder on a flat surface and crouch down so that your eyes are directly in front of and level with the meniscus of your liquid. Always read the measurement of our liquid at the bottom of the meniscus.
- Determine the volume of the water in the 10- and 100-mL graduated cylinders on your lab bench.
- Directly record the volumes with the correct sig figs and units on the report sheet.
- Underline the estimated digit for both of the measurements.
Part C Procedure: Mass by Subtraction, Range, Mean, and Standard Deviation
Measuring the mass of 3 stirring rods in a 250-mL beaker using mass by subtraction and determining the standard deviation of three stirring rod masses.
- Mass depends on the amount of matter in the object. Mass is also additive, which means the mass of several objects is equal to the sum of their individual masses. Based on these two properties, you will determine the mass of a glass stirring rod by using the mass by subtraction method.
- Take your graduated cylinder, stirring rods, pen, and report sheet to an electronic balance.
- Using an electronic balance, record the mass of you 250-mL beaker in Data Table 3.
- Remember to take your report sheet to the balance and immediately and directly record the mass value in the data table.
- Do not remove the 250-mL beaker from the balance until you have recorded its mass.
- Record every digit that is displayed on the balance and include correct units. - Sequentially add the stirring rods and record the total mass in Data Table 3 as follows:
- Add the first stirring rod to the 250-mL beaker and record its total mass in Data Table 3.
- Add the second stirring rod to the 250-mL beaker. Record the exact mass in Data Table 3.
- Add the third stirring rod to the 250-mL beaker and record the total mass in Data Table 3.
- Remember that the last digit that is displayed on the balance is the uncertain digit. Underline the uncertain digit of each mass in Data Table 3. - Calculate the mass of each stirring rod and record each mass in Data Table 4. To determine the masses of each stirring rod, follow these steps:
- Subtract the mass in column A from the mass in column B for the mass of the first stirring rod.
- Subtract the mass in column B from the mass of column C for the mass of the second stirring rod.
- Subtract the mass in column C form the mass in column D for the mass of the third stirring rod.
- Remember to record your answers with correct sig figs and units. Remember that the number of sig figs for subtraction depends on places after the decimal point. - Calculate the range of the masses record in Data Table 4.
- To calculate the range, subtract the smallest mass from the largest mass.
- Remember to follow the sig fig rules for subtraction and include the correct unit in your final answer. - Calculate the mean mass of the stirring rods.
- To calculate the mean, add the masses of the stirring rods and divide by the number of stirring rods (3 stirring rods). - Calculate the standard deviation. Remember that when calculating a standard deviation, you will NOT follow the standard sig fig rules.
- Express the mean with the number displayed in your calculator or with five sig figs after the decimal point – whichever value is less.
- Calculate the deviations (you may have negative values; express with three sig figs), the squared deviations (express 3 sig figs and use scientific notation; this value will be a positive number), and the sum of the squared deviations (express with three sig figs).
- Record these values in Data Table 5.
- Calculate the standard deviation for the mass of the three paper clips. Record the answer with correct units and two sig figs. - Express the mean of the masses and their standard deviation.
- Record your answer as the mean ± the standard deviation.
- Write the standard deviation with two sig figs with the unit of grams at the end.
- Ensure that your mean value has the same number of decimal places as your standard deviation.
- An example of the correct format for this is: 12.713 + 0.048 g.
Part D Procedure: Temperature Measurements and Percent Error
Determine the temperature of room temp water, cold water and ice water and calculate their percent error values.
- We'll be using a digital thermometer in this experiment and in future experiments in this course
- Place approximately 100 mL of room temperature tap water into a 250 mL beaker. Use a mixture of water from the cold and warm taps at the sink.
- Place approximately 75 mL of cold tap water into a 250 mL beaker. Add 2-3 ice cubes to the mixture to cool the water.
- Place approximately 300 mL of ice and ~50 mL of water (use your graduated cylinder to measure this water) into a 400 mL beaker to form an ice water mixture.
- Before you take your temperature measurements, stir each sample.
- When you take the temperature of your water samples:
- The cold water sample should not have any ice cubes in it
- The ice water sample should still be mostly ice.
- Keep the thermometer in the middle of each water sample when you determine the temperature.
- Wait until the temperature stabilizes before recording the temperature in Data Table 6.
- Record your temperature measurements in Celsius. - Record the temperature of each sample in Data Table 6 with correct sig figs and units in Data Table 6.
- Convert the temperature measurements from Celsius to Kelvin.
- To convert your temperature to Kelvin, simply add 273.15 to your temperature in Celsius.
- For example, a temperature of 32.2 °C is 305.35 K. Using the the rules for addition to determine the number of sig figs of the Kelvin
temperature, the temperature in Kelvin rounds to 305.3 K. Both temperatures will have the same number of digits after the decimal point as the Celsius value.
- Remember to show your work for credit and record the final answers with correct sig figs and units in Data Table 6. - Using the accepted value of ice water (273.15 K) and your experimentally determined temperature value of ice water in units of Kelvin, calculate the percent error.
- Express your final answer for percent error with two sig figs.
- To receive full credit, show your work, including the correct units. - Do not calculate a percent error for the other temperatures or water samples.
Clean Up
- Clean the glassware you used by rinsing thoroughly with tap water. No soap is needed in this lab because no chemicals were used in this experiment.
- Fill your wash bottle with deionized water. Rinse your glassware with a small amount of deionized water to remove the tap water.
- Return any item that did not come from your drawer (such as the extra stirring rods and metric ruler) to its original location.
Pre-Laboratory Questions
Answer these questions in your report sheet. Answer each prompt or question clearly using formal writing conventions. To receive full credit, correct grammar, spelling, capitalization, and punctuation and ensure your handwriting is legible by both you and your instructor. You are expected to answer these questions by using your lecture notes and this handout. Remember that you need to cite your sources if you use an online source to answer any of these questions cite by providing the website's url to avoid receiving a grade of 0 for plagiarism.
1. Define significant figures.
2. Where is the uncertain digit located in a recorded measurement?
3. Identify how many significant figures in the recorded measurement of 5.30 cm. Identify the certain digits(s) and the uncertain digit(s).
4. What physical property is measured by the unit cm?
5. What physical property is measured by the unit gram?
6. State the rule for subtracting and adding significant figures.
7. Explain how a mean is calculated.
8. Explain how the range of a data set is calculated.
Post-Laboratory Discussion
Answer each prompt clearly and thoroughly using formal writing conventions. For full credit, use correct grammar, spelling, capitalization, and punctuation.
- Critically evaluate your calculated mean length and masses of the stirring rods by stating whether your mean values are reasonable. Explain your answer.
- Is it possible to determine whether your mean values for the length and mass of the stirring rod are accurate? Explain your answer using the definition of accuracy.
- State whether the range is a measure of precision or accuracy. Use the definition of precision or accuracy to explain your answer.
- State whether percent error is a measure of precision or accuracy. Use the definition of precision or accuracy to explain your answer.
- State whether standard deviation is a measure of precision or accuracy. Use the definition of precision or accuracy to explain your answer.
- When you calculated the mean values of the length and the mass of the stirring rods, you divided the sum of the measurements by the number 3. Is the number 3 an exact or inexact number? This lab manual defines the terms exact and inexact numbers. Explain your answer to receive full credit.
- A student correctly recorded a volume of 9.5 mL in their report sheet. Did the student use a 10-mL or 100-mL graduated cylinder to measure this volume? Explain how you determined your answer.
Conclusion
Address whether the objective of this experiment lab has been met. To support your claim, give specific examples for each objective you listed in your objective statement. Include any quantitative data (such as the mean and range) when possible. Do not include subjective observations in your conclusion; subjective conclusions would include, "I learned a lot in this lab.", "This lab was fun.", and "I liked this experiment."
Feedback and Reflection
Identify 2-3 ways in which this lab activity relates to the material addressed in lecture or what you learned. Include any feedback about this experiment, such as its usefulness, ways it could be improved, directions that were complicated or difficult for you to understand, and any other constructive or positive feedback. Subjective observations are acceptable in this section.
Handing in Your Lab Report
You can either upload a scan or photo of the report sheet to Canvas as a single pdf document or turn in your report sheet directly to your lab instructor by the end of lab. Defer to the preference of your lab instructor regarding whether to turn in the lab report during lab or through Canvas.

Feedback/Errata