
2 3 | PROBABILITY TOPICS
Figure 3.1 Meteor showers are rare, but the probability of them occurring can be calculated. (credit: Navicore/flickr)
Introduction
It is often necessary to “guess” about the outcome of an event in order to make a decision. Politicians study polls to guess their likelihood of winning an election. Teachers choose a particular course of study based on what they think students can comprehend. Doctors choose the treatments needed for various diseases based on their assessment of likely results. You may have visited a casino where people play games chosen because of the belief that the likelihood of winning is good. You may have chosen your course of study based on the probable availability of jobs.
You have, more than likely, used probability. In fact, you probably have an intuitive sense of probability. Probability deals with the chance of an event occurring. Whenever you weigh the odds of whether or not to do your homework or to study for an exam, you are using probability. In this chapter, you will learn how to solve probability problems using a systematic approach.
3.1 | Terminology
Probability is a measure that is associated with how certain we are of outcomes of a particular experiment or activity. An experiment is a planned operation carried out under controlled conditions. If the result is not predetermined, then the experiment is said to be a chance experiment. Flipping one fair coin twice is an example of an experiment.
0.5 (the probability of heads).
six-sided die, each face (1, 2, 3, 4, 5, or 6) is as likely to occur as any other face. If you toss a fair coin, a Head (H) and a Tail (T) are equally likely to occur. If you randomly guess the answer to a true/false question on an exam, you are equally likely to select a correct answer or an incorrect answer.
To calculate the probability of an event A when all outcomes in the sample space are equally likely, count the number of outcomes for event A and divide by the total number of outcomes in the sample space. For example, if you toss a fair dime and a fair nickel, the sample space is {HH, TH, HT, TT} where T = tails and H = heads. The sample space has four
outcomes. A = getting one head. There are two outcomes that meet this condition {HT, TH}, so P(A) = 2
4
= 0.5.
Suppose you roll one fair six-sided die, with the numbers {1, 2, 3, 4, 5, 6} on its faces. Let event E = rolling a number that is at least five. There are two outcomes {5, 6}. P(E) = 2 . If you were to roll the die only a few times, you would not be
6
surprised if your observed results did not match the probability. If you were to roll the die a very large number of times, you
would expect that, overall, 2
6
of the rolls would result in an outcome of “at least five”. You would not expect exactly 2 .
6
The long-term relative frequency of obtaining this result would approach the theoretical probability of 2
6
as the number of
repetitions grows larger and larger.
∪ ” Event: The Union
An outcome is in the event A ∪ B if the outcome is in A or is in B or is in both A and B. For example, let A = {1, 2, 3, 4, 5} and B = {4, 5, 6, 7, 8}. A ∪ B = {1, 2, 3, 4, 5, 6, 7, 8}. Notice that 4 and 5 are NOT listed twice.
∩ ” Event: The Intersection
An outcome is in the event A ∩ B if the outcome is in both A and B at the same time. For example, let A and B be {1, 2, 3, 4, 5} and {4, 5, 6, 7, 8}, respectively. Then A ∩ B = {4, 5}.
+ P(A′) = 1. For example, let S = {1, 2, 3, 4, 5, 6} and let A = {1, 2, 3, 4}. Then, A′ = {5, 6}. P(A) = 4 , P(A′) = 2 , and
66
P(A) + P(A′) = 4 + 2 = 1
66
P(B)
sample space B. The formula to calculate P(A | B) is P(A | B) = P(A ∩ B) where P(B) is greater than zero.
For example, suppose we toss one fair, six-sided die. The sample space S = {1, 2, 3, 4, 5, 6}. Let A = face is 2 or 3 and B = face is even (2, 4, 6). To calculate P(A | B), we count the number of outcomes 2 or 3 in the sample space B = {2, 4, 6}. Then we divide that by the number of outcomes B (rather than S).
This OpenStax book is available for free at http://cnx.org/content/col11776/1.33
We get the same result by using the formula. Remember that S has six outcomes.
P(A ∩ B)
(the number of outcomes that are 2 or 3 and even inS)1
P(A | B) =
= 6= 6 = 1
Odds
P(B)
(the number of outcomes that are even inS)33
66
The odds of an event presents the probability as a ratio of success to failure. This is common in various gambling formats. Mathematically, the odds of an event can be defined as:
P(A)
1 − P(A)
where P(A) is the probability of success and of course 1 − P(A) is the probability of failure. Odds are always quoted as “numerator to denominator,” e.g. 2 to 1. Here the probability of winning is twice that of losing; thus, the probability of winning is 0.66. A probability of winning of 0.60 would generate odds in favor of winning of 3 to 2. While the calculation of odds can be useful in gambling venues in determining payoff amounts, it is not helpful for understanding probability or statistical theory.
Understanding Terminology and Symbols
It is important to read each problem carefully to think about and understand what the events are. Understanding the wording is the first very important step in solving probability problems. Reread the problem several times if necessary. Clearly identify the event of interest. Determine whether there is a condition stated in the wording that would indicate that the probability is conditional; carefully identify the condition, if any.
Example 3.1The sample space S is the whole numbers starting at one and less than 20.a. S = Let event A = the even numbers and event B = numbers greater than 13. b. A = , B = c. P(A) = , P(B) = d. A ∩ B = , A OR B = e. P(A ∩ B) = , P(A ∪ B) = f. A′ = , P(A′) = g. P(A) + P(A′) = h. P(A | B) = , P(B | A) = ; are the probabilities equal?Solution 3.1a.b.c.S = {1, 2, 3, 4, 5, 6, 7, 8, 9, 10, 11, 12, 13, 14, 15, 16, 17, 18, 19}A = {2, 4, 6, 8, 10, 12, 14, 16, 18}, B = {14, 15, 16, 17, 18, 19}P(A) =, P(B) = 919 619d. A ∩ B = {14,16,18}, A OR B = {2, 4, 6, 8, 10, 12, 14, 15, 16, 17, 18, 19}e.P(A ∩ B) = 319, P(A ∪ B) =1219f. A′ = 1, 3, 5, 7, 9, 11, 13, 15, 17, 19; P(A′) =1019g.P(A) + P(A′) = 1 ( 9 += 1)191910
h. P(A | B) = P(A ∩ B) = 3 , P(B | A) = P(A ∩ B) = 3 , No
P(B)6P(A)9
3.1 The sample space S is all the ordered pairs of two whole numbers, the first from one to three and the second from one to four (Example: (1, 4)).a. S = Let event A = the sum is even and event B = the first number is prime. b. A = , B = c. P(A) = , P(B) = d. A ∩ B = , A ∪ B = e. P(A ∩ B) = , P(A ∪ B) = f. B′ = , P(B′) = g. P(A) + P(A′) = h. P(A | B) = , P(B | A) = ; are the probabilities equal?
Example 3.2A fair, six-sided die is rolled. Describe the sample space S, identify each of the following events with a subset ofS and compute its probability (an outcome is the number of dots that show up).a.b.c.d.e.f.g.h.i.j.k.Event T = the outcome is two.Event A = the outcome is an even number. Event B = the outcome is less than four. The complement of A.A | BB | AA ∩A ∪A ∪B BB′Event N = the outcome is a prime number. Event I = the outcome is seven.Solution 3.2a. T = {2}, P(T) =16b. A = {2, 4, 6}, P(A) =12
This OpenStax book is available for free at http://cnx.org/content/col11776/1.33
c. B = {1, 2, 3}, P(B) = 1
2
d. A′ = {1, 3, 5}, P(A′) = 1
2
3
e. A | B = {2}, P(A | B) = 1
3
f. B | A = {2}, P(B | A) = 1
6
g. A ∩ B = {2}, P(A ∩ B) = 1
6
h. A ∪ B = {1, 2, 3, 4, 6}, P(A ∪ B) = 5
3
i. A ∪ B′ = {2, 4, 5, 6}, P(A ∪ B′) = 2
j. N = {2, 3, 5}, P(N) = 1
2
- Example 3.3Table 3.1 describes the distribution of a random sample S of 100 individuals, organized by gender and whether they are right- or left-handed.Table 3.1Let’s denote the events M = the subject is male, F = the subject is female, R = the subject is right-handed, L = the subject is left-handed. Compute the following probabilities:a.b.c.d.e.f.g.h.i.j.k.P(M)P(F)P(R)P(L) P(M ∩P(F ∩P(M ∪P(M ∪P(F ∪P(M’) P(R | M)R)L)F)R)L)
A six-sided die does not have seven dots. P(7) = 0.
|
|
Left-handed |
|
|
Males |
43 |
9 |
|
Females |
44 |
4 |
- P(F | L)
- P(L | F)
Solution 3.3
a. P(M) = 0.52
b. P(F) = 0.48
c. P(R) = 0.87
d. P(L) = 0.13
e. P(M ∩ R) = 0.43
f. P(F ∩ L) = 0.04
g. P(M ∪ F) = 1
h. P(M ∪ R) = 0.96
i. P(F ∪ L) = 0.57
j. P(M’) = 0.48
- P(R | M) = 0.8269 (rounded to four decimal places)
- P(F | L) = 0.3077 (rounded to four decimal places) m. P(L | F) = 0.0833
| Independent and Mutually Exclusive Events
Independent and mutually exclusive do not mean the same thing.
Independent Events
Two events are independent if one of the following are true:
• P(A|B) = P(A)
• P(B|A) = P(B)
• P(A ∩ B) = P(A)P(B)
Sampling may be done with replacement or without replacement.
- With replacement: If each member of a population is replaced after it is picked, then that member has the possibility of being chosen more than once. When sampling is done with replacement, then events are considered to be independent, meaning the result of the first pick will not change the probabilities for the second pick.
- Without replacement: When sampling is done without replacement, each member of a population may be chosen only once. In this case, the probabilities for the second pick are affected by the result of the first pick. The events are considered to be dependent or not independent.
If it is not known whether A and B are independent or dependent, assume they are dependent until you can show otherwise.
This OpenStax book is available for free at http://cnx.org/content/col11776/1.33
Example 3.4You have a fair, well-shuffled deck of 52 cards. It consists of four suits. The suits are clubs, diamonds, hearts and spades. There are 13 cards in each suit consisting of 1, 2, 3, 4, 5, 6, 7, 8, 9, 10, J (jack), Q (queen), K (king) of that suit.Sampling with replacement:Suppose you pick three cards with replacement. The first card you pick out of the 52 cards is the Q of spades. You put this card back, reshuffle the cards and pick a second card from the 52-card deck. It is the ten of clubs. You put this card back, reshuffle the cards and pick a third card from the 52-card deck. This time, the card is the Q of spades again. Your picks are {Q of spades, ten of clubs, Q of spades}. You have picked the Q of spades twice. You pick each card from the 52-card deck.Sampling without replacement:Suppose you pick three cards without replacement. The first card you pick out of the 52 cards is the K of hearts. You put this card aside and pick the second card from the 51 cards remaining in the deck. It is the three of diamonds. You put this card aside and pick the third card from the remaining 50 cards in the deck. The third card is the J of spades. Your picks are {K of hearts, three of diamonds, J of spades}. Because you have picked the cards without replacement, you cannot pick the same card twice. The probability of picking the three of diamonds is called a conditional probability because it is conditioned on what was picked first. This is true also of the probability of picking the J of spades. The probability of picking the J of spades is actually conditioned on both the previous picks.
You have a fair, well-shuffled deck of 52 cards. It consists of four suits. The suits are clubs, diamonds, hearts and spades. There are 13 cards in each suit consisting of 1, 2, 3, 4, 5, 6, 7, 8, 9, 10, J (jack), Q (queen), K (king) of that suit. Three cards are picked at random.Suppose you know that the picked cards are Q of spades, K of hearts and Q of spades. Can you decide if the sampling was with or without replacement?Suppose you know that the picked cards are Q of spades, K of hearts, and J of spades. Can you decide if the sampling was with or without replacement?
Example 3.5You have a fair, well-shuffled deck of 52 cards. It consists of four suits. The suits are clubs, diamonds, hearts, and spades. There are 13 cards in each suit consisting of 1, 2, 3, 4, 5, 6, 7, 8, 9, 10, J (jack), Q (queen), and K (king) of that suit. S = spades, H = Hearts, D = Diamonds, C = Clubs.Suppose you pick four cards, but do not put any cards back into the deck. Your cards are QS, 1D, 1C, QD.Suppose you pick four cards and put each card back before you pick the next card. Your cards are KH, 7D, 6D, KH.Which of a. or b. did you sample with replacement and which did you sample without replacement?Solution 3.5a. Without replacement; b. With replacement
3.5 You have a fair, well-shuffled deck of 52 cards. It consists of four suits. The suits are clubs, diamonds, hearts, and spades. There are 13 cards in each suit consisting of 1, 2, 3, 4, 5, 6, 7, 8, 9, 10, J (jack), Q (queen), and K (king) of that suit. S = spades, H = Hearts, D = Diamonds, C = Clubs. Suppose that you sample four cards without replacement. Which of the following outcomes are possible? Answer the same question for sampling with replacement.QS, 1D, 1C, QDKH, 7D, 6D, KHQS, 7D, 6D, KS
Mutually Exclusive Events
For example, suppose the sample space S = {1, 2, 3, 4, 5, 6, 7, 8, 9, 10}. Let A = {1, 2, 3, 4, 5}, B = {4, 5, 6, 7, 8}, and C =
10
{7, 9}. A ∩ B = {4, 5}. P(A ∩ B) = 2 and is not equal to zero. Therefore, A and B are not mutually exclusive. A and
C do not have any numbers in common so P(A ∩ C) = 0 . Therefore, A and C are mutually exclusive.
If it is not known whether A and B are mutually exclusive, assume they are not until you can show otherwise. The following examples illustrate these definitions and terms.
Flip two fair coins. (This is an experiment.)
The sample space is {HH, HT, TH, TT} where T = tails and H = heads. The outcomes are HH, HT, TH, and TT. The outcomes HT and TH are different. The HT means that the first coin showed heads and the second coin showed tails. The TH means that the first coin showed tails and the second coin showed heads.
- Let A = the event of getting at most one tail. (At most one tail means zero or one tail.) Then A can be written as {HH, HT, TH}. The outcome HH shows zero tails. HT and TH each show one tail.
- Let B = the event of getting all tails. B can be written as {TT}. B is the complement of A, so B = A′. Also,
P(A) + P(B) = P(A) + P(A′) = 1.
- The probabilities for A and for B are P(A) = 3
4
and P(B) = 1 .
4
- Let C = the event of getting all heads. C = {HH}. Since B = {TT}, P(B ∩ C) = 0 . B and C are mutually exclusive. (B and C have no members in common because you cannot have all tails and all heads at the same time.)
- Let D = event of getting more than one tail. D = {TT}. P(D) = 1
4
- Let E = event of getting a head on the first roll. (This implies you can get either a head or tail on the second roll.) E = {HT, HH}. P(E) = 2
4
- Find the probability of getting at least one (one or two) tail in two flips. Let F = event of getting at least one tail in two flips. F = {HT, TH, TT}. P(F) = 3
4
This OpenStax book is available for free at http://cnx.org/content/col11776/1.33
3.6 Draw two cards from a standard 52-card deck with replacement. Find the probability of getting at least one black card.
Example 3.7
Flip two fair coins. Find the probabilities of the events.
- Let F = the event of getting at most one tail (zero or one tail).
- Let G = the event of getting two faces that are the same.
- Let H = the event of getting a head on the first flip followed by a head or tail on the second flip.
- Are F and G mutually exclusive?
- Let J = the event of getting all tails. Are J and H mutually exclusive?
Solution 3.7
Look at the sample space in Example 3.6.
- Zero (0) or one (1) tails occur when the outcomes HH, TH, HT show up. P(F) = 3
4
- Two faces are the same if HH or TT show up. P(G) = 2
4
- A head on the first flip followed by a head or tail on the second flip occurs when HH or HT show up. P(H)
= 2
4
- F and G share HH so P(F ∩ G) is not equal to zero (0). F and G are not mutually exclusive.
- Getting all tails occurs when tails shows up on both coins (TT). H’s outcomes are HH and HT. J and H have nothing in common so P(J ∩ H) = 0. J and H are mutually exclusive.
3.7 A box has two balls, one white and one red. We select one ball, put it back in the box, and select a second ball (sampling with replacement). Find the probability of the following events:Let F = the event of getting the white ball twice.Let G = the event of getting two balls of different colors.Let H = the event of getting white on the first pick.Are F and G mutually exclusive?Are G and H mutually exclusive?
Example 3.8Roll one fair, six-sided die. The sample space is {1, 2, 3, 4, 5, 6}. Let event A = a face is odd. Then A = {1, 3, 5}. Let event B = a face is even. Then B = {2, 4, 6}.
- Find the complement of A, A′. The complement of A, A′, is B because A and B together make up the sample
space. P(A) + P(B) = P(A) + P(A′) = 1. Also, P(A) = 3
6
and P(B) = 3 .
6
- Let event C = odd faces larger than two. Then C = {3, 5}. Let event D = all even faces smaller than five. Then D = {2, 4}. P(C ∩ D) = 0 because you cannot have an odd and even face at the same time. Therefore,
C and D are mutually exclusive events.
- Let event E = all faces less than five. E = {1, 2, 3, 4}.
Are C and E mutually exclusive events? (Answer yes or no.) Why or why not?
Solution 3.8
No. C = {3, 5} and E = {1, 2, 3, 4}. P⎛C ∩ E⎞ = 1 . To be mutually exclusive, P(C ∩ E) must be zero.
⎝⎠6
- the original sample space {1, 2, 3, 4, 5, 6} to {1, 3, 5}. So, P⎛C A⎞ = 2 .
Find P(C|A) . This is a conditional probability. Recall that the event C is {3, 5} and event A is {1, 3, 5}. To find P(C|A) , find the probability of C using the sample space A. You have reduced the sample space from
⎝ | ⎠3
3.8 Let event A = learning Spanish. Let event B = learning German. Then A ∩ B = learning Spanish and German. Suppose P(A) = 0.4 and P(B) = 0.2 . P(A ∩ B) = 0.08 . Are events A and B independent? Hint: You must showONE of the following:• P(A|B) = P(A)• P(B|A) = P(B)• P(A ∩ B) = P(A)P(B)
Example 3.9Let event G = taking a math class. Let event H = taking a science class. Then, G ∩ H = taking a math class and a science class. Suppose P(G) = 0.6, P(H) = 0.5 , and P(G ∩ H) = 0.3. Are G and H independent?If G and H are independent, then you must show ONE of the following:• P(G|H) = P(G)• P(H|G) = P(H)• P(G ∩ H) = P(G)P(H)a. Show that P(G|H) = P(G) .NOTEThe choice you make depends on the information you have. You could choose any of the methods here because you have the necessary information.
This OpenStax book is available for free at http://cnx.org/content/col11776/1.33
P⎝G H⎠ = P(
= 0.3 = 0.6 = P⎝G⎠
So⎛lutio⎞n 3.9 G ∩H)⎛ ⎞
|P(H)0.5
- Show P(G ∩ H) = P(G)P(H) .
Solution 3.9
⎝
⎠
⎝
⎠
⎝
⎠
⎠
⎝
⎠
P⎛G⎞P⎛H⎞ = ⎛0.6⎞(0.5⎞ = 0.3 = P⎛G ∩ H⎞
Since G and H are independent, knowing that a person is taking a science class does not change the chance that he or she is taking a math class. If the two events had not been independent (that is, they are dependent) then knowing that a person is taking a science class would change the chance he or she is taking math. For practice,
show that P(H|G) = P(H) to show that G and H are independent events.
3.9 In a bag, there are six red marbles and four green marbles. The red marbles are marked with the numbers 1, 2, 3, 4, 5, and 6. The green marbles are marked with the numbers 1, 2, 3, and 4.R = a red marbleG = a green marbleO = an odd-numbered marbleThe sample space is S = {R1, R2, R3, R4, R5, R6, G1, G2, G3, G4}. S has ten outcomes. What is P(G ∩ O) ?
Example 3.10Let event C = taking an English class. Let event D = taking a speech class. Suppose P(C) = 0.75 , P(D) = 0.3 , P(C|D) = 0.75 and P(C ∩ D) = 0.225 .Justify your answers to the following questions numerically.Are C and D independent?Are C and D mutually exclusive?What is P(D|C) ?Solution 3.10Yes, because P(C|D) = P(C) .No, because P(C ∩ D) is not equal to zero.c.P D C =⎛⎞⎝⎠|P(C ∩ D)P(C)=0.2250.75= 0.3
A student goes to the library. Let events B = the student checks out a book and D = the student checks out a DVD. Suppose that P(B) = 0.40 , P(D) = 0.30 and P(B ∩ D) = 0.20 .Find P(B|D) .Find P(D|B) .Are B and D independent?Are B and D mutually exclusive?
Example 3.11
In a box there are three red cards and five blue cards. The red cards are marked with the numbers 1, 2, and 3, and the blue cards are marked with the numbers 1, 2, 3, 4, and 5. The cards are well-shuffled. You reach into the box (you cannot see into it) and draw one card.
Let R = red card is drawn, B = blue card is drawn, E = even-numbered card is drawn. The sample space S = R1, R2, R3, B1, B2, B3, B4, B5. S has eight outcomes.
- P⎛R⎞ = 3.P⎛B⎞ = 5.P⎛R ∩ B⎞ = 0 . (You cannot draw one card that is both red and blue.)
⎝ ⎠8 ⎝ ⎠8 ⎝⎠
- P⎛E⎞ = 3 . (There are three even-numbered cards, R2, B2, and B4.)
|
⎝ ⎠8
- 2
|
P(E B) = 5 . (There are five blue cards: B1, B2, B3, B4, and B5. Out of the blue cards, there are two even cards; B2 and B4.) - 2
P(B E) = 3 . (There are three even-numbered cards: R2, B2, and B4. Out of the even-numbered cards, to are blue; B2 and B4.) - The events R and B are mutually exclusive because P(R ∩ B) = 0 .
- Let G = card with a number greater than 3. G = {B4, B5}. P⎛G⎞ = 2 . Let H = blue card numbered between
⎝ ⎠8
1
4
one and four, inclusive. H = {B1, B2, B3, B4}. P(G|H) = 4 . (The only card in H that has a number greater
than three is B4.) Since 2
8
= 1 , P(G) = P(G|H) , which means that G and H are independent.
In a basketball arena,70% of the fans are rooting for the home team.25% of the fans are wearing blue.20% of the fans are wearing blue and are rooting for the away team.Of the fans rooting for the away team, 67% are wearing blue. Let A be the event that a fan is rooting for the away team.Let B be the event that a fan is wearing blue.
This OpenStax book is available for free at http://cnx.org/content/col11776/1.33
Are the events of rooting for the away team and wearing blue independent? Are they mutually exclusive?
Example 3.12
In a particular college class, 60% of the students are female. Fifty percent of all students in the class have long hair. Forty-five percent of the students are female and have long hair. Of the female students, 75% have long hair. Let F be the event that a student is female. Let L be the event that a student has long hair. One student is picked randomly. Are the events of being female and having long hair independent?
- The following probabilities are given in this example:
• P(F)=0.60; P(L)=0.50
• P(F ∩ L) = 0.45
NOTEThe choice you make depends on the information you have. You could use the first or last condition on the list for this example. You do not know P(F|L) yet, so you cannot use the second condition.
• P(L|F) = 0.75
Solution 1
Check whether P(F ∩ L) = P(F)P(L) . We are given that P(F ∩ L) = 0.45 , but P(F)P(L) = (0.60)(0.50) = 0.30 . The events of being female and having long hair are not independent because P(F ∩ L) does not equal P(F)P(L) .
Solution 2
Check whether P(L|F) equals P(L) . We are given that P(L|F) = 0.75 , but P(L) = 0.50 ; they are not equal. The events of being female and having long hair are not independent.
Interpretation of Results
The events of being female and having long hair are not independent; knowing that a student is female changes the probability that a student has long hair.
Mark is deciding which route to take to work. His choices are I = the Interstate and F = Fifth Street.• P(I) = 0.44 and P(F) = 0.56P(I ∩ F) = 0 because Mark will take only one route to work. What is the probability of P(I ∪ F) ?
Example 3.13Toss one fair coin (the coin has two sides, H and T). The outcomes are . Count the outcomes. There are outcomes.Toss one fair, six-sided die (the die has 1, 2, 3, 4, 5 or 6 dots on a side). The outcomes are
. Count the outcomes. There are outcomes.
- Multiply the two numbers of outcomes. The answer is .
- If you flip one fair coin and follow it with the toss of one fair, six-sided die, the answer to c is the number of outcomes (size of the sample space). What are the outcomes? (Hint: Two of the outcomes are H1 and T6.)
- Event A = heads (H) on the coin followed by an even number (2, 4, 6) on the die.
A = { }. Find P(A).
- Event B = heads on the coin followed by a three on the die. B = { }. Find P(B).
- Are A and B mutually exclusive? (Hint: What is P(A ∩ B) ? If P(A ∩ B) = 0 , then A and B are mutually exclusive.)
- Are A and B independent? (Hint: Is P(A ∩ B) = P(A)P(B) ? If P(A ∩ B) = P(A)P(B) , then A and B are independent. If not, then they are dependent).
Solution 3.13
a. H and T; 2
b. 1, 2, 3, 4, 5, 6; 6
c. 2(6) = 12
d. T1, T2, T3, T4, T5, T6, H1, H2, H3, H4, H5, H6
e. A = {H2, H4, H6}; P(A) = 3
12
f. B = {H3}; P(B) = 1
12
- Yes, because P(A ∩ B) = 0
- P⎛A ∩ B⎞ = 0.P⎛A⎞P⎛B⎞ = ( 3 ).P⎛A ∩ B⎞does not equalP⎛A⎞P⎛B⎞, soAandBare dependent.
⎝⎠⎝
⎠ ⎝ ⎠
12⎝⎠
⎝ ⎠ ⎝ ⎠
A box has two balls, one white and one red. We select one ball, put it back in the box, and select a second ball (sampling with replacement). Let T be the event of getting the white ball twice, F the event of picking the white ball first, S the event of picking the white ball in the second drawing.Compute P(T) .b.c.d.e.ComputeP(T|F) .Are T and F independent?.Are F and S mutually exclusive? Are F and S independent?
| Two Basic Rules of Probability
When calculating probability, there are two rules to consider when determining if two events are independent or dependent and if they are mutually exclusive or not.
The Multiplication Rule
This OpenStax book is available for free at http://cnx.org/content/col11776/1.33
This rule may also be written as: P⎛A B⎞ = P(A ∩ B)
⎝ | ⎠P(B)
This equation is read as the probability of A given B equals the probability of A and B divided by the probability of B.
because the P(A|B) = P(A) if A and B are independent.
One easy way to remember the multiplication rule is that the word “and” means that the event has to satisfy two conditions. For example the name drawn from the class roster is to be both a female and a sophomore. It is harder to satisfy two conditions than only one and of course when we multiply fractions the result is always smaller. This reflects the increasing difficulty of satisfying two conditions.
The Addition Rule
If A and B are defined on a sample space, then: P(A ∪ B) = P(A) + P(B) – P(A ∩ B) . We can think of the union symbol substituting for the word “or”. The reason we subtract the intersection of A and B is to keep from double counting elements that are in both A and B.
P(A ∪ B) = P(A) + P(B) .
Example 3.14Klaus is trying to choose where to go on vacation. His two choices are: A = New Zealand and B = AlaskaKlaus can only afford one vacation. The probability that he chooses A is P(A) = 0.6 and the probability that he chooses B is P(B) = 0.35.P(A ∩ B) = 0 because Klaus can only afford to take one vacationTherefore,theprobabilitythathechooseseitherNewZealandorAlaskaisP(A ∪ B) = P(A) + P(B) = 0.6 + 0.35 = 0.95 . Note that the probability that he does not choose to go anywhere on vacation must be 0.05.
Example 3.15Carlos plays college soccer. He makes a goal 65% of the time he shoots. Carlos is going to attempt two goals in a row in the next game. A = the event Carlos is successful on his first attempt. P(A) = 0.65. B = the event Carlos is successful on his second attempt. P(B) = 0.65. Carlos tends to shoot in streaks. The probability that he makes thesecond goal | that he made the first goal is 0.90.a. What is the probability that he makes both goals?Solution 3.15The problem is asking you to find P(A ∩ B) = P(B ∩ A) . Since P(B | A) = 0.90: P(B ∩ A) = P(B | A) P(A) = (0.90)(0.65) = 0.585Carlos makes the first and second goals with probability 0.585.What is the probability that Carlos makes either the first goal or the second goal?Solution 3.15b. The problem is asking you to find P(A ∪ B).
P(A ∪ B) = P(A) + P(B) – P(A ∩ B) = 0.65 + 0.65 – 0.585 = 0.715
Carlos makes either the first goal or the second goal with probability 0.715.
c. Are A and B independent?
Solution 3.15
- No, they are not, because P(B ∩ A) = 0.585.
P(B)P(A) = (0.65)(0.65) = 0.423 0.423 ≠ 0.585 = P(B ∩ A)
So, P(B ∩ A) is not equal to P(B)P(A).
- Are A and B mutually exclusive?
Solution 3.15
d. No, they are not because P(A ∩ B) = 0.585.
To be mutually exclusive, P(A ∩ B) must equal zero.
3.15 Helen plays basketball. For free throws, she makes the shot 75% of the time. Helen must now attempt two free throws. C = the event that Helen makes the first shot. P(C) = 0.75. D = the event Helen makes the second shot. P(D)= 0.75. The probability that Helen makes the second free throw given that she made the first is 0.85. What is the probability that Helen makes both free throws?
Example 3.16A community swim team has 150 members. Seventy-five of the members are advanced swimmers. Forty- seven of the members are intermediate swimmers. The remainder are novice swimmers. Forty of the advanced swimmers practice four times a week. Thirty of the intermediate swimmers practice four times a week. Ten of the novice swimmers practice four times a week. Suppose one member of the swim team is chosen randomly.a. What is the probability that the member is a novice swimmer?Solution 3.16a. 28150b. What is the probability that the member practices four times a week?Solution 3.16b. 80150c. What is the probability that the member is an advanced swimmer and practices four times a week?
This OpenStax book is available for free at http://cnx.org/content/col11776/1.33
Solution 3.16
c. 40
150
d. What is the probability that a member is an advanced swimmer and an intermediate swimmer? Are being an advanced swimmer and an intermediate swimmer mutually exclusive? Why or why not?
Solution 3.16
- P(advanced ∩ intermediate) = 0, so these are mutually exclusive events. A swimmer cannot be an advanced
swimmer and an intermediate swimmer at the same time.
- Are being a novice swimmer and practicing four times a week independent events? Why or why not?
Solution 3.16
e. No, these are not independent events.
P(novice ∩ practices four times per week) = 0.0667
P(novice)P(practices four times per week) = 0.0996 0.0667 ≠ 0.0996
3.16 A school has 200 seniors of whom 140 will be going to college next year. Forty will be going directly to work. The remainder are taking a gap year. Fifty of the seniors going to college play sports. Thirty of the seniors going directly to work play sports. Five of the seniors taking a gap year play sports. What is the probability that a senior is taking a gap year?
Example 3.17Felicity attends Modesto JC in Modesto, CA. The probability that Felicity enrolls in a math class is 0.2 and the probability that she enrolls in a speech class is 0.65. The probability that she enrolls in a math class | that she enrolls in speech class is 0.25.Let: M = math class, S = speech class, M | S = math given speechWhat is the probability that Felicity enrolls in math and speech? Find P(M ∩ S) = P(M | S)P(S).What is the probability that Felicity enrolls in math or speech classes? Find P(M ∪ S) = P(M) + P(S) – P(M ∩ S).Are M and S independent? Is P(M | S) = P(M)?Are M and S mutually exclusive? Is P(M ∩ S) = 0?Solution 3.17a. 0.1625, b. 0.6875, c. No, d. No
3.17 A student goes to the library. Let events B = the student checks out a book and D = the student check out a DVD.
Suppose that P(B) = 0.40, P(D) = 0.30 and P(D | B) = 0.5.Find P(B ∩ D).Find P(B ∪ D).
Studies show that about one woman in seven (approximately 14.3%) who live to be 90 will develop breast cancer. Suppose that of those women who develop breast cancer, a test is negative 2% of the time. Also suppose that in the general population of women, the test for breast cancer is negative about 85% of the time. Let B = woman develops breast cancer and let N = tests negative. Suppose one woman is selected at random.
- What is the probability that the woman develops breast cancer? What is the probability that woman tests negative?
Solution 3.18
a. P(B) = 0.143; P(N) = 0.85
- Given that the woman has breast cancer, what is the probability that she tests negative?
Solution 3.18
b. P(N | B) = 0.02
- What is the probability that the woman has breast cancer AND tests negative?
Solution 3.18
c. P(B ∩ N) = P(B)P(N | B) = (0.143)(0.02) = 0.0029
- What is the probability that the woman has breast cancer or tests negative?
Solution 3.18
d. P(B ∪ N) = P(B) + P(N) – P(B ∩ N) = 0.143 + 0.85 – 0.0029 = 0.9901
- Are having breast cancer and testing negative independent events?
Solution 3.18
- No. P(N) = 0.85; P(N | B) = 0.02. So, P(N | B) does not equal P(N).
- Are having breast cancer and testing negative mutually exclusive?
Solution 3.18
- No. P(B ∩ N) = 0.0029. For B and N to be mutually exclusive, P(B ∩ N) must be zero.
3.18 A school has 200 seniors of whom 140 will be going to college next year. Forty will be going directly to work. The remainder are taking a gap year. Fifty of the seniors going to college play sports. Thirty of the seniors going
This OpenStax book is available for free at http://cnx.org/content/col11776/1.33
directly to work play sports. Five of the seniors taking a gap year play sports. What is the probability that a senior is going to college and plays sports?
Example 3.19Refer to the information in Example 3.18. P = tests positive.Given that a woman develops breast cancer, what is the probability that she tests positive. Find P(P | B) = 1- P(N | B).What is the probability that a woman develops breast cancer and tests positive. Find P(B ∩ P) = P(P |B)P(B).What is the probability that a woman does not develop breast cancer. Find P(B′) = 1 – P(B).What is the probability that a woman tests positive for breast cancer. Find P(P) = 1 – P(N).Solution 3.19a. 0.98; b. 0.1401; c. 0.857; d. 0.15
A student goes to the library. Let events B = the student checks out a book and D = the student checks out a DVD. Suppose that P(B) = 0.40, P(D) = 0.30 and P(D | B) = 0.5.Find P(B′).Find P(D ∩ B).Find P(B | D).Find P(D ∩ B′).Find P(D | B′).
| Contingency Tables and Probability Trees
Contingency Tables
Example 3.20
Suppose a study of speeding violations and drivers who use cell phones produced the following fictional data:
|
|
Speeding violation in the last year |
No speeding violation in the last year |
Total |
|
Uses cell phone while driving |
25 |
280 |
305 |
|
Does not use cell phone while driving |
45 |
405 |
450 |
|
Total |
70 |
685 |
755 |
Table 3.2
The total number of people in the sample is 755. The row totals are 305 and 450. The column totals are 70 and 685. Notice that 305 + 450 = 755 and 70 + 685 = 755.
Calculate the following probabilities using the table.
a. Find P(Driver is a cell phone user).
Solution 3.20
a. number of cell phone users total number in study
305
=
755
b. Find P(Driver had no violation in the last year).
Solution 3.20
b. number that had no violation total number in study
685
=
755
c. Find P(Driver had no violation in the last year ∩ was a cell phone user).
Solution 3.20
c. 280
755
- Find P(Driver is a cell phone user ∪ driver had no violation in the last year).
Solution 3.20
d. ⎛305 + 685⎞ − 280 = 710
⎝755755⎠755755
- Find P(Driver is a cell phone user | driver had a violation in the last year).
Solution 3.20
- 25 70
(The sample space is reduced to the number of drivers who had a violation.)
- Find P(Driver had no violation last year | driver was not a cell phone user)
This OpenStax book is available for free at http://cnx.org/content/col11776/1.33
Solution 3.20
f. 405
3.20 Table 3.3 shows the number of athletes who stretch before exercising and how many had injuries within the past year.Table 3.3What is P(athlete stretches before exercising)?What is P(athlete stretches before exercising | no injury in the last year)?
450
(The sample space is reduced to the number of drivers who were not cell phone users.)
Example 3.21Table 3.4 shows a random sample of 100 hikers and the areas of hiking they prefer.Table 3.4 Hiking Area Preferencea. Complete the table.Solution 3.21a.Table 3.5 Hiking Area Preference
|
|
No injury in last year |
Total |
|
|
Stretches |
55 |
295 |
350 |
|
Does not stretch |
231 |
219 |
450 |
|
Total |
286 |
514 |
800 |
|
The Coastline |
Near Lakes and Streams |
On Mountain Peaks |
Total |
|
|
Female |
18 |
16 |
|
45 |
|
Male |
|
|
14 |
55 |
|
Total |
|
41 |
|
|
|
Sex |
The Coastline |
Near Lakes and Streams |
On Mountain Peaks |
Total |
|
Female |
18 |
16 |
11 |
45 |
|
Male |
16 |
25 |
14 |
55 |
|
Total |
34 |
41 |
25 |
100 |
- Are the events “being female” and “preferring the coastline” independent events? Let F = being female and let C = preferring the coastline.
- Find P(F ∩ C) .
- Find P(F)P(C)
Are these two numbers the same? If they are, then F and C are independent. If they are not, then F and C are not independent.
Solution 3.21
b.
1. P⎛F ∩ C⎞ = 18
= 0.18
⎝⎠100
⎝⎠⎝⎠
2. P(F)P(C) = ⎛ 45 ⎞⎛ 34 ⎞ = (0.45)(0.34) = 0.153
100 100
P(F ∩ C) ≠ P(F)P(C), so the events F and C are not independent.
- Find the probability that a person is male given that the person prefers hiking near lakes and streams. Let M = being male, and let L = prefers hiking near lakes and streams.
- What word tells you this is a conditional?
- Fill in the blanks and calculate the probability: P( | ) = .
- Is the sample space for this problem all 100 hikers? If not, what is it?
Solution 3.21
c.
41
1. The word ‘given’ tells you that this is a conditional. 2. P(M | L) = 25
3. No, the sample space for this problem is the 41 hikers who prefer lakes and streams.
- Find the probability that a person is female or prefers hiking on mountain peaks. Let F = being female, and let
P = prefers mountain peaks.
- Find P(F).
- Find P(P).
- Find P(F ∩ P) .
- Find P(F ∪ P) .
Solution 3.21
d.
1. P(F) = 45
100
2. P(P) = 25
100
100
3. P(F ∩ P) = 11
This OpenStax book is available for free at http://cnx.org/content/col11776/1.33
3.21 Table 3.6 shows a random sample of 200 cyclists and the routes they prefer. Let M = males and H = hilly path.Table 3.6Out of the males, what is the probability that the cyclist prefers a hilly path?Are the events “being male” and “preferring the hilly path” independent events?
100
4. P(F ∪ P) = 45
+ 25
100
– 11 100
= 59
100
Example 3.22Muddy Mouse lives in a cage with three doors. If Muddy goes out the first door, the probability that he gets caughtby Alissa the cat isand the probability he is not caught is 4 . If he goes out the second door, the probability he155gets caught by Alissa isand the probability he is not caught is 3 . The probability that Alissa catches Muddy144coming out of the third door isand the probability she does not catch Muddy is 1 . It is equally likely that2Muddy will choose any of the three doors so the probability of choosing each door is121 .3Table 3.7 Door ChoiceThe first entry 115= ⎛1⎞⎛1⎞ is⎝5⎠⎝3⎠P⎛Door One ∩ Caught⎞⎝⎠The entry 415= ⎛4⎞⎛1⎞ is⎝5⎠⎝3⎠P⎛Door One ∩ Not Caught⎞⎝⎠Verify the remaining entries.
|
Lake Path |
Hilly Path |
Wooded Path |
Total |
|
|
Female |
45 |
38 |
27 |
110 |
|
Male |
26 |
52 |
12 |
90 |
|
Total |
71 |
90 |
39 |
200 |
|
Caught or Not |
Door One |
Door Two |
Door Three |
Total |
|
Caught |
1 15 |
1 12 |
1 6 |
|
|
Not Caught |
4 15 |
3 12 |
1 6 |
|
|
Total |
|
|
|
1 |
- Complete the probability contingency table. Calculate the entries for the totals. Verify that the lower-right corner entry is 1.
Solution 3.22
a.
|
Caught or Not |
Door One |
Door Two |
Door Three |
Total |
|
Caught |
1 15 |
1 12 |
1 6 |
19 60 |
|
Not Caught |
4 15 |
3 12 |
1 6 |
41 60 |
|
Total |
5 15 |
4 12 |
2 6 |
1 |
Table 3.8 Door Choice
- What is the probability that Alissa does not catch Muddy?
Solution 3.22
- 41 60
- What is the probability that Muddy chooses Door One ∪ Door Two given that Muddy is caught by Alissa?
Solution 3.22
- Example 3.23Table 3.9 contains the number of crimes per 100,000 inhabitants from 2008 to 2011 in the U.S.Table 3.9 United States Crime Index Rates Per 100,000 Inhabitants 2008–2011TOTAL each column and each row. Total data = 4,520.7Find P⎛2009 ∩ Robbery⎞ .⎝⎠Find P⎛2010 ∩ Burglary⎞ .⎝⎠
9 19
|
Robbery |
Burglary |
Rape |
Vehicle |
Total |
|
|
2008 |
145.7 |
732.1 |
29.7 |
314.7 |
|
|
2009 |
133.1 |
717.7 |
29.1 |
259.2 |
|
|
2010 |
119.3 |
701 |
27.7 |
239.1 |
|
|
2011 |
113.7 |
702.2 |
26.8 |
229.6 |
|
|
Total |
|
|
|
|
|
This OpenStax book is available for free at http://cnx.org/content/col11776/1.33
- Find P⎛2010 ∪ Burglary⎞ .
⎝⎠
- Find P(2011 | Rape).
- Find P(Vehicle | 2008).
Solution 3.23
a. 0.0294, b. 0.1551, c. 0.7165, d. 0.2365, e. 0.2575
|
Tall |
Medium |
Short |
Totals |
|
|
Obese |
18 |
28 |
14 |
|
|
Normal |
20 |
51 |
28 |
|
|
Underweight |
12 |
25 |
9 |
|
|
Totals |
|
|
|
|
3.23 Table 3.10 relates the weights and heights of a group of individuals participating in an observational study.Table 3.10Find the total for each row and columnFind the probability that a randomly chosen individual from this group is Tall.Find the probability that a randomly chosen individual from this group is Obese and Tall.Find the probability that a randomly chosen individual from this group is Tall given that the idividual is Obese.Find the probability that a randomly chosen individual from this group is Obese given that the individual is Tall.Find the probability a randomly chosen individual from this group is Tall and Underweight.Are the events Obese and Tall independent?
Tree Diagrams
Sometimes, when the probability problems are complex, it can be helpful to graph the situation. Tree diagrams can be used to visualize and solve conditional probabilities.
Tree Diagrams
Example 3.24In an urn, there are 11 balls. Three balls are red (R) and eight balls are blue (B). Draw two balls, one at a time, with replacement. “With replacement” means that you put the first ball back in the urn before you select the second ball. The tree diagram using frequencies that show all the possible outcomes follows.
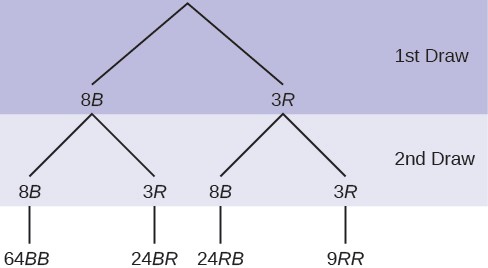
Figure 3.2 Total = 64 + 24 + 24 + 9 = 121
The first set of branches represents the first draw. The second set of branches represents the second draw. Each of the outcomes is distinct. In fact, we can list each red ball as R1, R2, and R3 and each blue ball as B1, B2, B3, B4, B5, B6, B7, and B8. Then the nine RR outcomes can be written as:
R1R1; R1R2; R1R3; R2R1; R2R2; R2R3; R3R1; R3R2; R3R3
The other outcomes are similar.
There are a total of 11 balls in the urn. Draw two balls, one at a time, with replacement. There are 11(11) = 121 outcomes, the size of the sample space.
- List the 24 BR outcomes: B1R1, B1R2, B1R3, …
Solution 3.24
a. B1R1; B1R2; B1R3; B2R1; B2R2; B2R3; B3R1; B3R2; B3R3; B4R1; B4R2; B4R3; B5R1; B5R2; B5R3; B6R1;
B6R2; B6R3; B7R1; B7R2; B7R3; B8R1; B8R2; B8R3
- Using the tree diagram, calculate P(RR).
Solution 3.24
b. P(RR) = ⎛ 3 ⎞⎛ 3 ⎞ = 9
⎝11⎠⎝11⎠
121
c. Using the tree diagram, calculate P(RB ∪ BR) .
Solution 3.24
c. P(RB ∪ BR) = ⎛ 3 ⎞⎛ 8 ⎞ + ⎛ 8 ⎞⎛ 3 ⎞ = 48
⎝11⎠⎝11⎠
⎝11⎠⎝11⎠
121
d. Using the tree diagram, calculate P(R on 1st draw ∩ B on 2nd draw) .
Solution 3.24
d. P(R on 1st draw ∩ B on 2nd draw) = ⎛ 3 ⎞⎛ 8 ⎞ = 24
⎝11⎠⎝11⎠
121
e. Using the tree diagram, calculate P(R on 2nd draw | B on 1st draw).
This OpenStax book is available for free at http://cnx.org/content/col11776/1.33
Solution 3.24
- 88
P(R on 2nd draw | B on 1st draw) = P(R on 2nd | B on 1st) = 24
= 3 11
This problem is a conditional one. The sample space has been reduced to those outcomes that already have a blue on the first draw. There are 24 + 64 = 88 possible outcomes (24 BR and 64 BB). Twenty-four of the 88 possible
outcomes are BR. 24
88
= 3 .
11
- Using the tree diagram, calculate P(BB).
Solution 3.24
f. P(BB) = 64
121
- Using the tree diagram, calculate P(B on the 2nd draw | R on the first draw).
Solution 3.24
11
g. P(B on 2nd draw | R on 1st draw) = 8
There are 9 + 24 outcomes that have R on the first draw (9 RR and 24 RB). The sample space is then 9 + 24 = 33. 24 of the 33 outcomes have B on the second draw. The probability is then 24 .
33
3.24 In a standard deck, there are 52 cards. 12 cards are face cards (event F) and 40 cards are not face cards (event N). Draw two cards, one at a time, with replacement. All possible outcomes are shown in the tree diagram as frequencies. Using the tree diagram, calculate P(FF).Figure 3.3
Example 3.25
An urn has three red marbles and eight blue marbles in it. Draw two marbles, one at a time, this time without replacement, from the urn. “Without replacement” means that you do not put the first ball back before you select the second marble. Following is a tree diagram for this situation. The branches are labeled with probabilities instead of frequencies. The numbers at the ends of the branches are calculated by multiplying the numbers on the
two corresponding branches, for example, ⎛ 3 ⎞⎛ 2 ⎞ = 6 .
⎝11⎠⎝10⎠110
Figure 3.4 Total = 56 + 24 + 24 + 6 = 110 = 1
110110
NOTEIf you draw a red on the first draw from the three red possibilities, there are two red marbles left to draw on the second draw. You do not put back or replace the first marble after you have drawn it. You draw without replacement, so that on the second draw there are ten marbles left in the urn.
Calculate the following probabilities using the tree diagram.
- P(RR) =
Solution 3.25
a. P(RR) = ⎛ 3 ⎞⎛ 2 ⎞ = 6
⎝11⎠⎝10⎠110
- Fill in the blanks:
P(RB ∪ BR) = ⎛ 3 ⎞⎛ 8 ⎞ + ( )( ) = 48
⎝11⎠⎝10⎠
110
This OpenStax book is available for free at http://cnx.org/content/col11776/1.33
Solution 3.25
b. P(RB ∪ BR) = ⎛ 3 ⎞⎛ 8 ⎞ + ⎛ 8 ⎞⎛ 3 ⎞ = 48
⎝11⎠⎝10⎠⎝11⎠⎝10⎠110
c. P(R on 2nd | B on 1st) =
Solution 3.25
- 10
P(R on 2nd | B on 1st) = 3
- Fill in the blanks.
100
P(R on 1st ∩ B on 2nd) = ( )( ) = 24
Solution 3.25
d. P(R on 1st ∩ B on 2nd) = ⎛ 3 ⎞⎛ 8 ⎞ = 24
⎝11⎠⎝10⎠100
- Find P(BB).
Solution 3.25
⎝⎠⎝⎠
e. P(BB) = ⎛ 8 ⎞⎛ 7 ⎞
11 10
- Find P(B on 2nd | R on 1st).
Solution 3.25
- 10
Using the tree diagram, P(B on 2nd | R on 1st) = P(R | B) = 8 .
If we are using probabilities, we can label the tree in the following general way.
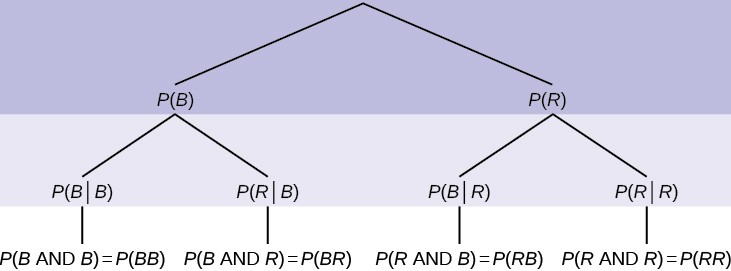
- P(R | R) here means P(R on 2nd | R on 1st)
- P(B | R) here means P(B on 2nd | R on 1st)
- P(R | B) here means P(R on 2nd | B on 1st)
- P(B | B) here means P(B on 2nd | B on 1st)
3.25 In a standard deck, there are 52 cards. Twelve cards are face cards (F) and 40 cards are not face cards (N). Draw two cards, one at a time, without replacement. The tree diagram is labeled with all possible probabilities.Figure 3.5Find P(FN ∪ NF) .Find P(N | F).Find P(at most one face card).Hint: “At most one face card” means zero or one face card.Find P(at least on face card).Hint: “At least one face card” means one or two face cards.
Example 3.26A litter of kittens available for adoption at the Humane Society has four tabby kittens and five black kittens. A family comes in and randomly selects two kittens (without replacement) for adoption.
This OpenStax book is available for free at http://cnx.org/content/col11776/1.33
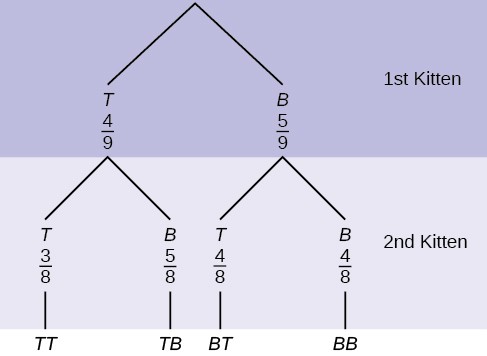
- What is the probability that both kittens are tabby?
a. ⎛1⎞⎛1⎞ b. ⎛4⎞⎛4⎞ c. ⎛4⎞⎛3⎞ d. ⎛4⎞⎛5⎞
⎝2⎠⎝2⎠⎝9⎠⎝9⎠⎝9⎠⎝8⎠⎝9⎠⎝9⎠
- What is the probability that one kitten of each coloring is selected?
a. ⎛4⎞⎛5⎞ b. ⎛4⎞⎛5⎞ c. ⎛4⎞⎛5⎞ + ⎛5⎞⎛4⎞ d. ⎛4⎞⎛5⎞ + ⎛5⎞⎛4⎞
⎝9⎠⎝9⎠⎝9⎠⎝8⎠⎝9⎠⎝9⎠⎝9⎠⎝9⎠⎝9⎠⎝8⎠⎝9⎠⎝8⎠
- What is the probability that a tabby is chosen as the second kitten when a black kitten was chosen as the first?
- What is the probability of choosing two kittens of the same color?
Solution 3.26
a. c, b. d, c. 4 , d. 32
872
3.26 Suppose there are four red balls and three yellow balls in a box. Two balls are drawn from the box without replacement. What is the probability that one ball of each coloring is selected?
| Venn Diagrams
Venn Diagrams
Venn diagrams are named for their inventor, John Venn, a mathematics professor at Cambridge and an Anglican minister. His main work was conducted during the late 1870’s and gave rise to a whole branch of mathematics and a new way to approach issues of logic. We will develop the probability rules just covered using this powerful way to demonstrate the probability postulates including the Addition Rule, Multiplication Rule, Complement Rule, Independence, and Conditional
Probability.
Example 3.27Suppose an experiment has the outcomes 1, 2, 3, … , 12 where each outcome has an equal chance of occurring. Let event A = {1, 2, 3, 4, 5, 6} and event B = {6, 7, 8, 9}. Then A intersect B = A ∩ B = {6} and A union B =A ∪ B = {1, 2, 3, 4, 5, 6, 7, 8, 9}. . The Venn diagram is as follows:Figure 3.6
Figure 3.6 shows the most basic relationship among these numbers. First, the numbers are in groups called sets; set A and set B. Some number are in both sets; we say in set A ∩ in set B. The English word “and” means inclusive, meaning having the characteristics of both A and B, or in this case, being a part of both A and B. This condition is called the INTERSECTION of the two sets. All members that are part of both sets constitute the intersection of the two sets. The intersection is written as A ∩ B where ∩ is the mathematical symbol for intersection. The statement A ∩ B is read as “A intersect B.” You can remember this by thinking of the intersection of two streets.
There are also those numbers that form a group that, for membership, the number must be in either one or the other group. The number does not have to be in BOTH groups, but instead only in either one of the two. These numbers are called the UNION of the two sets and in this case they are the numbers 1-5 (from A exclusively), 7-9 (from set B exclusively) and also
6, which is in both sets A and B. The symbol for the UNION is ∪ , thus A ∪ B = numbers 1-9, but excludes number 10,
11, and 12. The values 10, 11, and 12 are part of the universe, but are not in either of the two sets.
3.27 Suppose an experiment has outcomes black, white, red, orange, yellow, green, blue, and purple, where each outcome has an equal chance of occurring. Let event C = {green, blue, purple} and event P = {red, yellow, blue}. Then C ∩ P = {blue} and C ∪ P = {green, blue, purple, red, yellow} . Draw a Venn diagram representing thissituation.
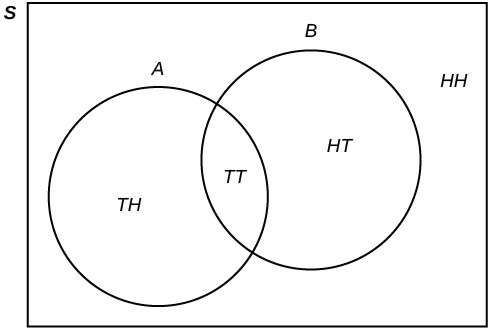
Example 3.28Flip two fair coins. Let A = tails on the first coin. Let B = tails on the second coin. Then A = {TT, TH} and B ={TT, HT}. Therefore, A ∩ B = {TT} . A ∪ B = {TH, TT, HT} .The sample space when you flip two fair coins is X = {HH, HT, TH, TT}. The outcome HH is in NEITHER ANOR B. The Venn diagram is as follows:
Translating the English word “AND” into the mathematical logic symbol ∩ , intersection, and the word “OR” into the mathematical symbol ∪ , union, provides a very precise way to discuss the issues of probability and logic. The general terminology for the three areas of the Venn diagram in Figure 3.6 is shown in Figure 3.7.
This OpenStax book is available for free at http://cnx.org/content/col11776/1.33
3.28 Roll a fair, six-sided die. Let A = a prime number of dots is rolled. Let B = an odd number of dots is rolled. ThenA = {2, 3, 5} and B = {1, 3, 5}. Therefore, A ∩ B = {3, 5} . A ∪ B = {1, 2, 3, 5} . The sample space for rolling afair die is S = {1, 2, 3, 4, 5, 6}. Draw a Venn diagram representing this situation.Example 3.29A person with type O blood and a negative Rh factor (Rh-) can donate blood to any person with any blood type. Four percent of African Americans have type O blood and a negative RH factor, 5−10% of African Americans have the Rh- factor, and 51% have type O blood.
Figure 3.8The “O” circle represents the African Americans with type O blood. The “Rh-“ oval represents the African Americans with the Rh- factor.We will take the average of 5% and 10% and use 7.5% as the percent of African Americans who have the Rh- factor. Let O = African American with Type O blood and R = African American with Rh- factor.P(O) = P(R) = P(O ∩ R) = P(O ∪ R) = In the Venn Diagram, describe the overlapping area using a complete sentence.In the Venn Diagram, describe the area in the rectangle but outside both the circle and the oval using a complete sentence.
Example 3.30Forty percent of the students at a local college belong to a club and 50% work part time. Five percent of the students work part time and belong to a club. Draw a Venn diagram showing the relationships. Let C = student belongs to a club and PT = student works part time.
This OpenStax book is available for free at http://cnx.org/content/col11776/1.33
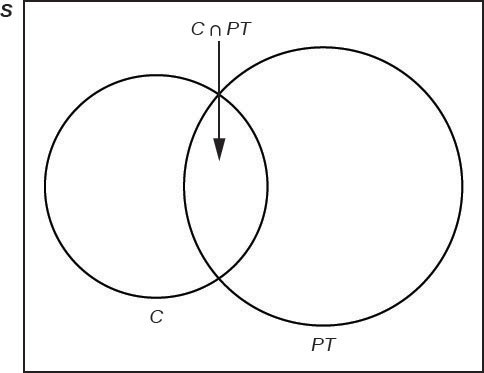
Figure 3.9
If a student is selected at random, find
- the probability that the student belongs to a club. P(C) = 0.40
- the probability that the student works part time. P(PT) = 0.50
- the probability that the student belongs to a club AND works part time. P(C ∩ PT) = 0.05
- the probability that the student belongs to a club given that the student works part time.
P(C|PT) = P(C ∩ PT) = 0.05 = 0.1
P(PT)0.50
- theprobabilitythatthestudentbelongstoaclubORworkspart time.
P(C ∪ PT) = P(C) + P(PT) – P(C ∩ PT) = 0.40 + 0.50 – 0.05 = 0.85
In order to solve Example 3.30 we had to draw upon the concept of conditional probability from the previous section. There we used tree diagrams to track the changes in the probabilities, because the sample space changed as we drew without replacement. In short, conditional probability is the chance that something will happen given that some other event has already happened. Put another way, the probability that something will happen conditioned upon the situation that
something else is also true. In Example 3.30 the probability P(C | PT) is the conditional probability that the randomly
3.30 Fifty percent of the workers at a factory work a second job, 25% have a spouse who also works, 5% work a second job and have a spouse who also works. Draw a Venn diagram showing the relationships. Let W = works a second job and S = spouse also works.
drawn student is a member of the club, conditioned upon the fact that the student also is working part time. This allows us to see the relationship between Venn diagrams and the probability postulates.
In a bookstore, the probability that the customer buys a novel is 0.6, and the probability that the customer buys a non-fiction book is 0.4. Suppose that the probability that the customer buys both is 0.2.Draw a Venn diagram representing the situation.Find the probability that the customer buys either a novel or a non-fiction book.In the Venn diagram, describe the overlapping area using a complete sentence.Suppose that some customers buy only compact disks. Draw an oval in your Venn diagram representing this event.
A set of 20 German Shepherd dogs is observed. 12 are male, 8 are female, 10 have some brown coloring, and 5 have some white sections of fur. Answer the following using Venn Diagrams.
Draw a Venn diagram simply showing the sets of male and female dogs.
Solution 3.31
The Venn diagram below demonstrates the situation of mutually exclusive events where the outcomes are independent events. If a dog cannot be both male and female, then there is no intersection. Being male precludes being female and being female precludes being male: in this case, the characteristic gender is therefore mutually exclusive. A Venn diagram shows this as two sets with no intersection. The intersection is said to be the null set using the mathematical symbol ∅.
Figure 3.10
Draw a second Venn diagram illustrating that 10 of the male dogs have brown coloring.
Solution 3.31
The Venn diagram below shows the overlap between male and brown where the number 10 is placed in it. This represents Male ∩ Brown : both male and brown. This is the intersection of these two characteristics. To get the union of Male and Brown, then it is simply the two circled areas minus the overlap. In proper terms, Male ∪ Brown = Male + Brown − Male ∩ Brown will give us the number of dogs in the union of these two
This OpenStax book is available for free at http://cnx.org/content/col11776/1.33
sets. If we did not subtract the intersection, we would have double counted some of the dogs.
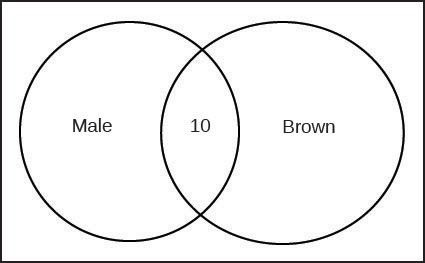
Figure 3.11
Now draw a situation depicting a scenario in which the non-shaded region represents “No white fur and female,” or White fur′ ∩ Female. the prime above “fur” indicates “not white fur.” The prime above a set means not in that set, e.g. A′ means not A . Sometimes, the notation used is a line above the letter. For example, A¯ = A′ .
Solution 3.31
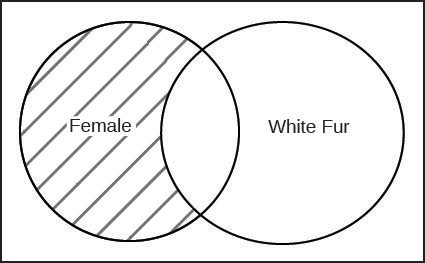
Figure 3.12
The Addition Rule of Probability
We met the addition rule earlier but without the help of Venn diagrams. Venn diagrams help visualize the counting process that is inherent in the calculation of probability. To restate the Addition Rule of Probability:
P(A ∪ B) = P(A) + P(B) − P(A ∩ B)
Remember that probability is simply the proportion of the objects we are interested in relative to the total number of objects. This is why we can see the usefulness of the Venn diagrams. Example 3.31 shows how we can use Venn diagrams to count the number of dogs in the union of brown and male by reminding us to subtract the intersection of brown and male. We can see the effect of this directly on probabilities in the addition rule.
Let’s sample 50 students who are in a statistics class. 20 are freshmen and 30 are sophomores. 15 students get a “B” in the course, and 5 students both get a “B” and are freshmen.
Find the probability of selecting a student who either earns a “B” OR is a freshmen. We are translating the word OR to the mathematical symbol for the addition rule, which is the union of the two sets.
Solution 3.32
We know that there are 50 students in our sample, so we know the denominator of our fraction to give us probability. We need only to find the number of students that meet the characteristics we are interested in, i.e. any freshman and any student who earned a grade of “B.” With the Addition Rule of probability, we can skip directly to probabilities.
Let “A” = the number of freshmen, and let “B” = the grade of “B.” Below we can see the process for using Venn diagrams to solve this.
The P⎛A⎞ = 20 = 0.40 , P⎛B⎞ = 15 = 0.30 , and P⎛A ∩ B⎞ = 5
= 0.10 .
⎝ ⎠50
⎝ ⎠50
⎝⎠50
Therefore, P(A ∩ B) = 0.40 + 0.30 − 0.10 = 0.60 .
Figure 3.13
If two events are mutually exclusive, then, like the example where we diagram the male and female dogs, the addition rule is simplified to just P(A ∪ B) = P(A) + P(B) − 0 . This is true because, as we saw earlier, the
union of mutually exclusive events is the null set, ∅. The diagrams below demonstrate this.
This OpenStax book is available for free at http://cnx.org/content/col11776/1.33
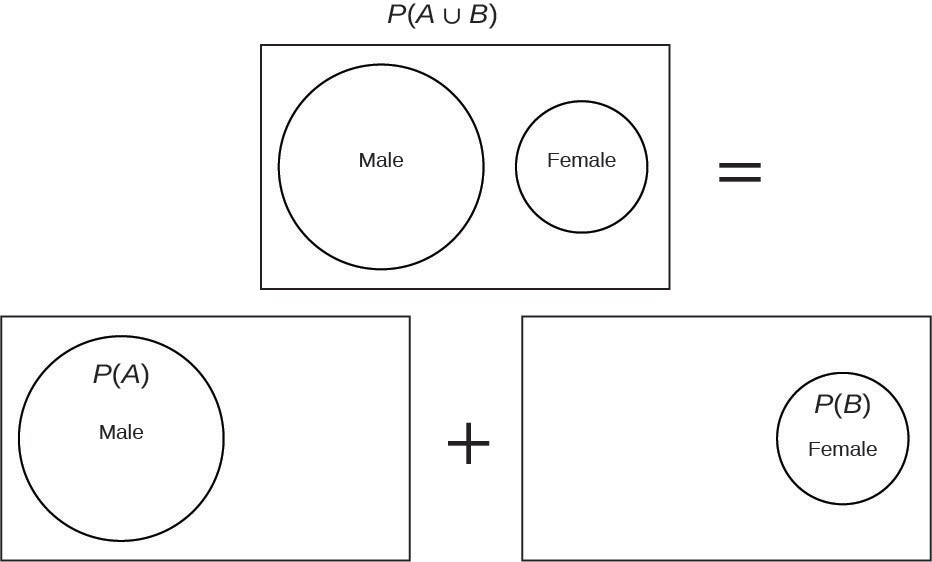
Figure 3.14
The Multiplication Rule of Probability
Restating the Multiplication Rule of Probability using the notation of Venn diagrams, we have:
P(A ∩ B) = P(A|B) ⋅ P(B)
The multiplication rule can be modified with a bit of algebra into the following conditional rule. Then Venn diagrams can then be used to demonstrate the process.
P(B)
The conditional rule: P(A|B) = P(A ∩ B)
Using the same facts from Example 3.32 above, find the probability that someone will earn a “B” if they are a “freshman.”
P(A|B) = 0.10 = 1
0.303
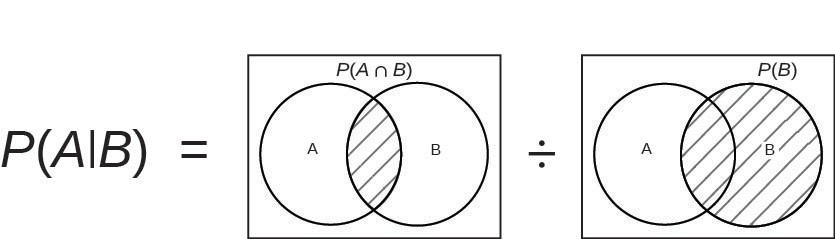
Figure 3.15
The multiplication rule must also be altered if the two events are independent. Independent events are defined as a situation where the conditional probability is simply the probability of the event of interest. Formally, independence of events is defined as P(A|B) = P(A) or P(B|A) = P(B) . When flipping coins, the outcome of the second flip is independent of the
outcome of the first flip; coins do not have memory. The Multiplication Rule of Probability for independent events thus becomes:
P(A ∩ B) = P(A) ⋅ P(B)
One easy way to remember this is to consider what we mean by the word “and.” We see that the Multiplication Rule has translated the word “and” to the Venn notation for intersection. Therefore, the outcome must meet the two conditions of freshmen and grade of “B” in the above example. It is harder, less probable, to meet two conditions than just one or some other one. We can attempt to see the logic of the Multiplication Rule of probability due to the fact that fractions multiplied times each other become smaller.
Example 3.33Table 3.11 is from a sample of 200 people who were asked how much education they completed. The columns represent the highest education they completed, and the rows separate the individuals by male and female.Table 3.11Now, we can use this table to answer probability questions. The following examples are designed to help understand the format above while connecting the knowledge to both Venn diagrams and the probability rules.What is the probability that a selected person both finished college and is female?Solution 3.33This is a simple task of finding the value where the two characteristics intersect on the table, and then applying the postulate of probability, which states that the probability of an event is the proportion of outcomes that match the event in which we are interested as a proportion of all total possible outcomes.
The development of the Rules of Probability with the use of Venn diagrams can be shown to help as we wish to calculate probabilities from data arranged in a contingency table.
|
|
High School Grad |
Some College |
College Grad |
Total |
|
|
Male |
5 |
15 |
40 |
60 |
120 |
|
Female |
8 |
12 |
30 |
30 |
80 |
|
Total |
13 |
27 |
70 |
90 |
200 |
This OpenStax book is available for free at http://cnx.org/content/col11776/1.33
200
P(College Grad ∩ Female) = 30
= 0.15
What is the probability of selecting either a female or someone who finished college?
Solution 3.33
This task involves the use of the addition rule to solve for this probability.
+
−
P(College Grad ∪ Female) = P(F) + P(CG)− P(F ∩ CG)
200
P(College Grad ∪ Female) = 80
90 200
30 200
= 140 = 0.70
200
What is the probability of selecting a high school graduate if we only select from the group of males?
Solution 3.33
Here we must use the conditional probability rule (the modified multiplication rule) to solve for this probability.
⎛ 15 ⎞
P(HS Grad | Male = P(HS Grad ∩ Male) = ⎝200⎠ = 15
= 0.125
⎝⎠
P(Male)
⎛120⎞
200
120
Can we conclude that the level of education attained by these 200 people is independent of the gender of the person?
Solution 3.33
There are two ways to approach this test. The first method seeks to test if the intersection of two events equals the product of the events separately remembering that if two events are independent than P(A)*P(B) = P(A ∩ B). For simplicity’s sake, we can use calculated values from above.
≠
⋅
Does P(College Grad ∩ Female) = P(CG) ⋅ P(F)?
30 200
90 200
80 200
because 0.15 ≠ 0.18.
Therefore, gender and education here are not independent.
The second method is to test if the conditional probability of A given B is equal to the probability of A. Again for simplicity, we can use an already calculated value from above.
≠
Does P(HS Grad | Male) = P(HS Grad)?
15 120
27 200
because 0.125 ≠ 0.135.
Therefore, again gender and education here are not independent.
Dependent Events If two events are NOT independent, then we say that they are dependent.
Equally Likely Each outcome of an experiment has the same probability.
Experiment a planned activity carried out under controlled conditions
Events A and B are independent if one of the following is true: 1. P(A|B) = P(A)
2. P(B|A) = P(B)
3. P(A ∩ B) = P(A)P(B)
Outcome a particular result of an experiment
• 0 ≤ P(A) ≤ 1
- If A and B are any two mutually exclusive events, then P(A ∪ B) = P(A) + P(B).
• P(S) = 1
Sample Space the set of all possible outcomes of an experiment
The Complement Event The complement of event A consists of all outcomes that are NOT in A.
This OpenStax book is available for free at http://cnx.org/content/col11776/1.33
intersections
CHAPTER REVIEW
In this module we learned the basic terminology of probability. The set of all possible outcomes of an experiment is called the sample space. Events are subsets of the sample space, and they are assigned a probability that is a number between zero and one, inclusive.
Independent and Mutually Exclusive Events
Two events A and B are independent if the knowledge that one occurred does not affect the chance the other occurs. If two events are not independent, then we say that they are dependent.
In sampling with replacement, each member of a population is replaced after it is picked, so that member has the possibility of being chosen more than once, and the events are considered to be independent. In sampling without replacement, each member of a population may be chosen only once, and the events are considered not to be independent. When events do not share outcomes, they are mutually exclusive of each other.
Two Basic Rules of Probability
The multiplication rule and the addition rule are used for computing the probability of A and B, as well as the probability of A or B for two given events A, B defined on the sample space. In sampling with replacement each member of a population is replaced after it is picked, so that member has the possibility of being chosen more than once, and the events are considered to be independent. In sampling without replacement, each member of a population may be chosen only once, and the events are considered to be not independent. The events A and B are mutually exclusive events when they do not have any outcomes in common.
Contingency Tables and Probability Trees
There are several tools you can use to help organize and sort data when calculating probabilities. Contingency tables help display data and are particularly useful when calculating probabilites that have multiple dependent variables.
A tree diagram use branches to show the different outcomes of experiments and makes complex probability questions easy to visualize.
A Venn diagram is a picture that represents the outcomes of an experiment. It generally consists of a box that represents the sample space S or universe of the objects of interest together with circles or ovals. The circles or ovals represent groups of events called sets. A Venn diagram is especially helpful for visualizing the ∪ event, the ∩ event, and the complement of an event and for understanding conditional probabilities. A Venn diagram is especially helpful for visualizing an Intersection
of two events, a Union of two events, or a Complement of one event. A system of Venn diagrams can also help to understand Conditional probabilities. Venn diagrams connect the brain and eyes by matching the literal arithmetic to a picture. It is important to note that more than one Venn diagram is needed to solve the probability rule formulas introduced in Section 3.3.
FORMULA REVIEW
A and B are events
Independent and Mutually Exclusive Events
⎝
⎠
⎝ ⎠ ⎝ ⎠
⎝
⎠
⎝ ⎠
⎝
⎠
⎝ ⎠
⎝⎠⎝ ⎠⎝ ⎠⎝⎠
If AandBare independent,P⎛A ∩ B⎞ = P⎛A⎞P⎛B⎞, P⎛A|B⎞ = P⎛A⎞andP⎛B|A⎞ = P⎛B⎞.
P(S) = 1 where S is the sample space 0 ≤ P(A) ≤ 1
P(B)
P(A | B) = P(A ∩ B)
If AandBare mutually exclusive,P⎛A ∪ B⎞ = P⎛A⎞ + P⎛B⎞andP⎛A ∩ B⎞ = 0.
B)
Two Basic Rules of Probability
The multiplication rule: P(A ∩ B) = P(A | B)P(B)
The addition rule: P(A ∪ B) = P(A) + P(B) – P(A ∩
PRACTICE
- In a particular college class, there are male and female students. Some students have long hair and some students have short hair. Write the symbols for the probabilities of the events for parts a through j. (Note that you cannot find numerical answers here. You were not given enough information to find any probability values yet; concentrate on understanding the symbols.)
- Let F be the event that a student is female.
- Let M be the event that a student is male.
- Let S be the event that a student has short hair.
- Let L be the event that a student has long hair.
- The probability that a student does not have long hair.
- The probability that a student is male or has short hair.
- The probability that a student is a female and has long hair.
- The probability that a student is male, given that the student has long hair.
- The probability that a student has long hair, given that the student is male.
- Of all the female students, the probability that a student has short hair.
- Of all students with long hair, the probability that a student is female.
- The probability that a student is female or has long hair.
- The probability that a randomly selected student is a male student with short hair.
- The probability that a student is female.
Use the following information to answer the next four exercises. A box is filled with several party favors. It contains 12 hats, 15 noisemakers, ten finger traps, and five bags of confetti.
Let H = the event of getting a hat.
Let N = the event of getting a noisemaker. Let F = the event of getting a finger trap.
Let C = the event of getting a bag of confetti.
- Find P(H).
- Find P(N).
- Find P(F).
- Find P(C).
Use the following information to answer the next six exercises. A jar of 150 jelly beans contains 22 red jelly beans, 38 yellow, 20 green, 28 purple, 26 blue, and the rest are orange.
Let B = the event of getting a blue jelly bean Let G = the event of getting a green jelly bean.
Let O = the event of getting an orange jelly bean. Let P = the event of getting a purple jelly bean. Let R = the event of getting a red jelly bean.
Let Y = the event of getting a yellow jelly bean.
- Find P(B).
- Find P(G).
- Find P(P).
- Find P(R).
- Find P(Y).
This OpenStax book is available for free at http://cnx.org/content/col11776/1.33
Use the following information to answer the next six exercises. There are 23 countries in North America, 12 countries in South America, 47 countries in Europe, 44 countries in Asia, 54 countries in Africa, and 14 in Oceania (Pacific Ocean region).
Let A = the event that a country is in Asia. Let E = the event that a country is in Europe. Let F = the event that a country is in Africa.
Let N = the event that a country is in North America. Let O = the event that a country is in Oceania.
Let S = the event that a country is in South America.
- Find P(A).
- Find P(E).
- Find P(F).
- Find P(N).
- Find P(O).
- Find P(S).
- What is the probability of drawing a red card in a standard deck of 52 cards?
- What is the probability of drawing a club in a standard deck of 52 cards?
- What is the probability of rolling an even number of dots with a fair, six-sided die numbered one through six?
- What is the probability of rolling a prime number of dots with a fair, six-sided die numbered one through six?
Use the following information to answer the next two exercises. You see a game at a local fair. You have to throw a dart at a color wheel. Each section on the color wheel is equal in area.
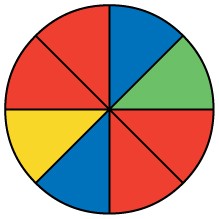
Figure 3.16
Let B = the event of landing on blue. Let R = the event of landing on red. Let G = the event of landing on green. Let Y = the event of landing on yellow.
- If you land on Y, you get the biggest prize. Find P(Y).
- If you land on red, you don’t get a prize. What is P(R)?
Use the following information to answer the next ten exercises. On a baseball team, there are infielders and outfielders. Some players are great hitters, and some players are not great hitters.
Let I = the event that a player in an infielder. Let O = the event that a player is an outfielder. Let H = the event that a player is a great hitter.
Let N = the event that a player is not a great hitter.
- Write the symbols for the probability that a player is not an outfielder.
- Write the symbols for the probability that a player is an outfielder or is a great hitter.
- Write the symbols for the probability that a player is an infielder and is not a great hitter.
- Write the symbols for the probability that a player is a great hitter, given that the player is an infielder.
- Write the symbols for the probability that a player is an infielder, given that the player is a great hitter.
- Write the symbols for the probability that of all the outfielders, a player is not a great hitter.
- Write the symbols for the probability that of all the great hitters, a player is an outfielder.
- Write the symbols for the probability that a player is an infielder or is not a great hitter.
- Write the symbols for the probability that a player is an outfielder and is a great hitter.
- Write the symbols for the probability that a player is an infielder.
- What is the word for the set of all possible outcomes?
- What is conditional probability?
- A shelf holds 12 books. Eight are fiction and the rest are nonfiction. Each is a different book with a unique title. The fiction books are numbered one to eight. The nonfiction books are numbered one to four. Randomly select one book
Let F = event that book is fiction Let N = event that book is nonfiction What is the sample space?
Use the following information to answer the next two exercises. You are rolling a fair, six-sided number cube. Let E = the event that it lands on an even number. Let M = the event that it lands on a multiple of three.
- What does P(E | M) mean in words?
- What does P(E ∪ M) mean in words?
Independent and Mutually Exclusive Events
- ⎝
⎠
⎝
⎠
⎝
⎠
EandFare mutually exclusive events. P⎛E⎞ = 0.4; P⎛F⎞ = 0.5.FindP⎛E ∣ F⎞. - ⎝
⎠
⎝ ⎠
JandKare independent events.P⎛J|K⎞ = 0.3.FindP⎛J⎞. - U and V are mutually exclusive events. P(U) = 0.26; P(V) = 0.37. Find:
- P(U ∩ V) =
- P(U|V) =
- P(U ∪ V) =
- ⎝
⎠
⎝
⎠
⎝
⎠
QandRare independent events.P⎛Q⎞ = 0.4andP⎛Q ∩ R⎞ = 0.1.FindP⎛R⎞.
Two Basic Rules of Probability
Use the following information to answer the next ten exercises. Forty-eight percent of all Californians registered voters prefer life in prison without parole over the death penalty for a person convicted of first degree murder. Among Latino California registered voters, 55% prefer life in prison without parole over the death penalty for a person convicted of first degree murder. 37.6% of all Californians are Latino.
This OpenStax book is available for free at http://cnx.org/content/col11776/1.33
In this problem, let:
- C = Californians (registered voters) preferring life in prison without parole over the death penalty for a person convicted of first degree murder.
- L = Latino Californians
Suppose that one Californian is randomly selected.
- Find P(C).
- Find P(L).
- Find P(C | L).
- In words, what is C | L?
- Find P(L ∩ C).
- In words, what is L ∩ C?
- Are L and C independent events? Show why or why not.
- Find P(L ∪ C).
- In words, what is L ∪ C?
- Are L and C mutually exclusive events? Show why or why not.
Use the following information to answer the next four exercises. Table 3.12 shows a random sample of musicians and how they learned to play their instruments.
|
Self-taught |
Studied in School |
Private Instruction |
Total |
|
|
Female |
12 |
38 |
22 |
72 |
|
Male |
19 |
24 |
15 |
58 |
|
Total |
31 |
62 |
37 |
130 |
Table 3.12
- Find P(musician is a female).
- Find P(musician is a male ∩ had private instruction).
- Find P(musician is a female ∪ is self taught).
- Are the events “being a female musician” and “learning music in school” mutually exclusive events?
- The probability that a man develops some form of cancer in his lifetime is 0.4567. The probability that a man has at least one false positive test result (meaning the test comes back for cancer when the man does not have it) is 0.51. Let: C = a man develops cancer in his lifetime; P = man has at least one false positive. Construct a tree diagram of the situation.
BRINGING IT TOGETHER: PRACTICE
Use the following information to answer the next seven exercises. An article in the New England Journal of Medicine, reported about a study of smokers in California and Hawaii. In one part of the report, the self-reported ethnicity and smoking levels per day were given. Of the people smoking at most ten cigarettes per day, there were 9,886 African Americans, 2,745 Native Hawaiians, 12,831 Latinos, 8,378 Japanese Americans, and 7,650 Whites. Of the people smoking 11 to 20 cigarettes per day, there were 6,514 African Americans, 3,062 Native Hawaiians, 4,932 Latinos, 10,680 Japanese Americans, and 9,877 Whites. Of the people smoking 21 to 30 cigarettes per day, there were 1,671 African Americans, 1,419 Native Hawaiians, 1,406 Latinos, 4,715 Japanese Americans, and 6,062 Whites. Of the people smoking at least 31 cigarettes per
day, there were 759 African Americans, 788 Native Hawaiians, 800 Latinos, 2,305 Japanese Americans, and 3,970 Whites.
- Complete the table using the data provided. Suppose that one person from the study is randomly selected. Find the probability that person smoked 11 to 20 cigarettes per day.
|
Smoking Level |
African American |
Native Hawaiian |
Latino |
Japanese Americans |
White |
TOTALS |
|
1–10 |
|
|
|
|
|
|
|
11–20 |
|
|
|
|
|
|
|
21–30 |
|
|
|
|
|
|
|
31+ |
|
|
|
|
|
|
|
TOTALS |
|
|
|
|
|
|
Table 3.13 Smoking Levels by Ethnicity
- Suppose that one person from the study is randomly selected. Find the probability that person smoked 11 to 20 cigarettes per day.
- Find the probability that the person was Latino.
- In words, explain what it means to pick one person from the study who is “Japanese American AND smokes 21 to 30 cigarettes per day.” Also, find the probability.
- In words, explain what it means to pick one person from the study who is “Japanese American ∪ smokes 21 to 30 cigarettes per day.” Also, find the probability.
- In words, explain what it means to pick one person from the study who is “Japanese American | that person smokes 21 to 30 cigarettes per day.” Also, find the probability.
- Prove that smoking level/day and ethnicity are dependent events.
Use the following information to answer the next two exercises. Suppose that you have eight cards. Five are green and three are yellow. The cards are well shuffled.
- Suppose that you randomly draw two cards, one at a time, with replacement. Let G1 = first card is green
Let G2 = second card is green
- Draw a tree diagram of the situation.
- Find P(G1 ∩ G2).
- Find P(at least one green).
- Find P(G2 | G1).
- Are G2 and G1 independent events? Explain why or why not.
- Suppose that you randomly draw two cards, one at a time, without replacement.
G1 = first card is green
G2 = second card is green
- Draw a tree diagram of the situation.
- Find P(G1 ∩ G2).
- Find P(at least one green).
- Find P(G2 | G1).
- Are G2 and G1 independent events? Explain why or why not.
Use the following information to answer the next two exercises. The percent of licensed U.S. drivers (from a recent year) that are female is 48.60. Of the females, 5.03% are age 19 and under; 81.36% are age 20–64; 13.61% are age 65 or over. Of the licensed U.S. male drivers, 5.04% are age 19 and under; 81.43% are age 20–64; 13.53% are age 65 or over.
This OpenStax book is available for free at http://cnx.org/content/col11776/1.33
- Complete the following.
- Construct a table or a tree diagram of the situation.
- Find P(driver is female).
- Find P(driver is age 65 or over | driver is female).
- Find P(driver is age 65 or over ∩ female).
- In words, explain the difference between the probabilities in part c and part d.
- Find P(driver is age 65 or over).
- Are being age 65 or over and being female mutually exclusive events? How do you know?
- Suppose that 10,000 U.S. licensed drivers are randomly selected.
- How many would you expect to be male?
- Using the table or tree diagram, construct a contingency table of gender versus age group.
- Using the contingency table, find the probability that out of the age 20–64 group, a randomly selected driver is female.
- Approximately 86.5% of Americans commute to work by car, truck, or van. Out of that group, 84.6% drive alone and 15.4% drive in a carpool. Approximately 3.9% walk to work and approximately 5.3% take public transportation.
- Construct a table or a tree diagram of the situation. Include a branch for all other modes of transportation to work.
- Assuming that the walkers walk alone, what percent of all commuters travel alone to work?
- Suppose that 1,000 workers are randomly selected. How many would you expect to travel alone to work?
- Suppose that 1,000 workers are randomly selected. How many would you expect to drive in a carpool?
- When the Euro coin was introduced in 2002, two math professors had their statistics students test whether the Belgian one Euro coin was a fair coin. They spun the coin rather than tossing it and found that out of 250 spins, 140 showed a head (event H) while 110 showed a tail (event T). On that basis, they claimed that it is not a fair coin.
- Based on the given data, find P(H) and P(T).
- Use a tree to find the probabilities of each possible outcome for the experiment of tossing the coin twice.
- Use the tree to find the probability of obtaining exactly one head in two tosses of the coin.
- Use the tree to find the probability of obtaining at least one head.
HOMEWORK
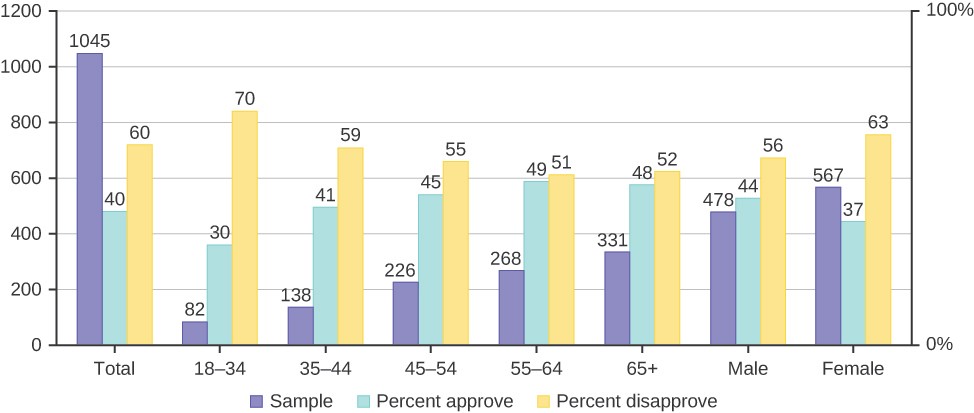
Figure 3.17 The graph in Figure 3.17 displays the sample sizes and percentages of people in different age and gender groups who were polled concerning their approval of Mayor Ford’s actions in office. The total number in the sample of all the age groups is 1,045.
- Define three events in the graph.
- Describe in words what the entry 40 means.
- Describe in words the complement of the entry in question 2.
- Describe in words what the entry 30 means.
- Out of the males and females, what percent are males?
- Out of the females, what percent disapprove of Mayor Ford?
- Out of all the age groups, what percent approve of Mayor Ford?
- Find P(Approve | Male).
- Out of the age groups, what percent are more than 44 years old?
- Find P(Approve | Age < 35).
- Explain what is wrong with the following statements. Use complete sentences.
- If there is a 60% chance of rain on Saturday and a 70% chance of rain on Sunday, then there is a 130% chance of rain over the weekend.
- The probability that a baseball player hits a home run is greater than the probability that he gets a successful hit.
Independent and Mutually Exclusive Events
Use the following information to answer the next 12 exercises. The graph shown is based on more than 170,000 interviews done by Gallup that took place from January through December 2012. The sample consists of employed Americans 18 years of age or older. The Emotional Health Index Scores are the sample space. We randomly sample one Emotional Health Index Score.
This OpenStax book is available for free at http://cnx.org/content/col11776/1.33
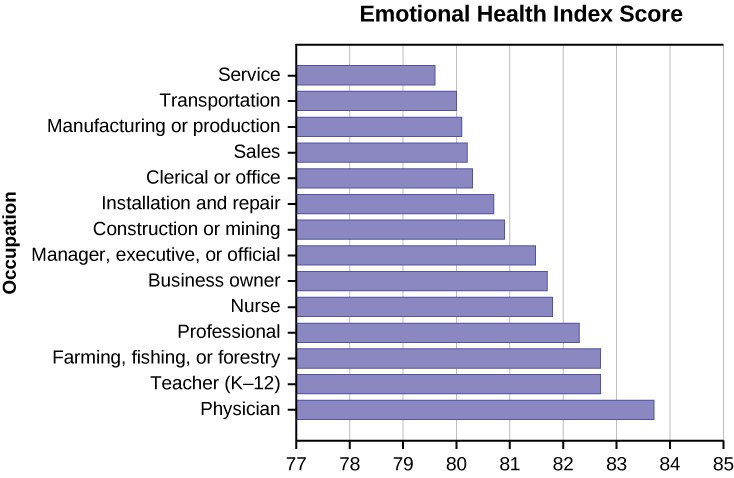
Figure 3.18
- Find the probability that an Emotional Health Index Score is 82.7.
- Find the probability that an Emotional Health Index Score is 81.0.
- Find the probability that an Emotional Health Index Score is more than 81?
- Find the probability that an Emotional Health Index Score is between 80.5 and 82?
- If we know an Emotional Health Index Score is 81.5 or more, what is the probability that it is 82.7?
- What is the probability that an Emotional Health Index Score is 80.7 or 82.7?
- What is the probability that an Emotional Health Index Score is less than 80.2 given that it is already less than 81.
- What occupation has the highest emotional index score?
- What occupation has the lowest emotional index score?
- What is the range of the data?
- Compute the average EHIS.
- If all occupations are equally likely for a certain individual, what is the probability that he or she will have an occupation with lower than average EHIS?
Two Basic Rules of Probability
- On February 28, 2013, a Field Poll Survey reported that 61% of California registered voters approved of allowing two people of the same gender to marry and have regular marriage laws apply to them. Among 18 to 39 year olds (California registered voters), the approval rating was 78%. Six in ten California registered voters said that the upcoming Supreme Court’s ruling about the constitutionality of California’s Proposition 8 was either very or somewhat important to them. Out of those CA registered voters who support same-sex marriage, 75% say the ruling is important to them.
In this problem, let:
- C = California registered voters who support same-sex marriage.
- B = California registered voters who say the Supreme Court’s ruling about the constitutionality of California’s Proposition 8 is very or somewhat important to them
- A = California registered voters who are 18 to 39 years old.
- Find P(C).
- Find P(B).
- Find P(C | A).
- Find P(B|C).
- In words, what is C | A?
- In words, what is B | C?
- Find P(C ∩ B).
- In words, what is C ∩ B?
- Find P(C ∪ B).
- Are C and B mutually exclusive events? Show why or why not.
- After Rob Ford, the mayor of Toronto, announced his plans to cut budget costs in late 2011, the Forum Research polled 1,046 people to measure the mayor’s popularity. Everyone polled expressed either approval or disapproval. These are the results their poll produced:
- In early 2011, 60 percent of the population approved of Mayor Ford’s actions in office.
- In mid-2011, 57 percent of the population approved of his actions.
- In late 2011, the percentage of popular approval was measured at 42 percent.
- What is the sample size for this study?
- What proportion in the poll disapproved of Mayor Ford, according to the results from late 2011?
- How many people polled responded that they approved of Mayor Ford in late 2011?
- What is the probability that a person supported Mayor Ford, based on the data collected in mid-2011?
- What is the probability that a person supported Mayor Ford, based on the data collected in early 2011?
Use the following information to answer the next three exercises. The casino game, roulette, allows the gambler to bet on the probability of a ball, which spins in the roulette wheel, landing on a particular color, number, or range of numbers. The table used to place bets contains of 38 numbers, and each number is assigned to a color and a range.
This OpenStax book is available for free at http://cnx.org/content/col11776/1.33
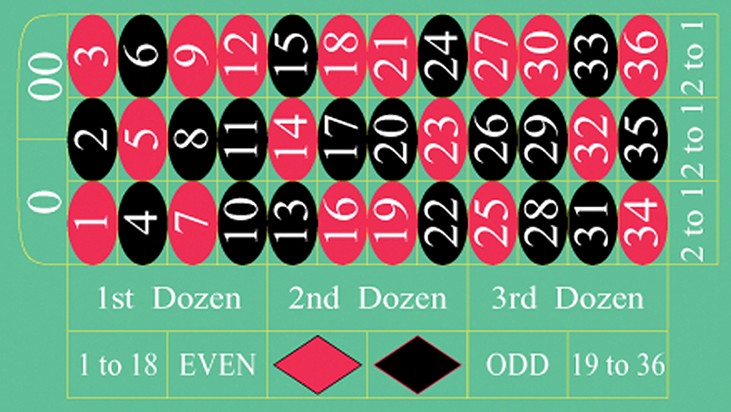
Figure 3.19 (credit: film8ker/wikibooks)
- List the sample space of the 38 possible outcomes in roulette.
- You bet on red. Find P(red).
- You bet on -1st 12- (1st Dozen). Find P(-1st 12-).
- You bet on an even number. Find P(even number).
- Is getting an odd number the complement of getting an even number? Why?
- Find two mutually exclusive events.
- Are the events Even and 1st Dozen independent?
- Compute the probability of winning the following types of bets:
- Betting on two lines that touch each other on the table as in 1-2-3-4-5-6
- Betting on three numbers in a line, as in 1-2-3
- Betting on one number
- Betting on four numbers that touch each other to form a square, as in 10-11-13-14
- Betting on two numbers that touch each other on the table, as in 10-11 or 10-13
- Betting on 0-00-1-2-3
g. Betting on 0-1-2; or 0-00-2; or 00-2-3
- Compute the probability of winning the following types of bets:
- Betting on a color
- Betting on one of the dozen groups
- Betting on the range of numbers from 1 to 18
- Betting on the range of numbers 19–36
- Betting on one of the columns
- Betting on an even or odd number (excluding zero)
- Suppose that you have eight cards. Five are green and three are yellow. The five green cards are numbered 1, 2, 3, 4, and 5. The three yellow cards are numbered 1, 2, and 3. The cards are well shuffled. You randomly draw one card.
- G = card drawn is green
- E = card drawn is even-numbered
- List the sample space.
- P(G) =
- P(G | E) =
- P(G ∩ E) =
- P(G ∪ E) =
- Are G and E mutually exclusive? Justify your answer numerically.
- Roll two fair dice separately. Each die has six faces.
- List the sample space.
- Let A be the event that either a three or four is rolled first, followed by an even number. Find P(A).
- Let B be the event that the sum of the two rolls is at most seven. Find P(B).
- In words, explain what “P(A | B)” represents. Find P(A | B).
- Are A and B mutually exclusive events? Explain your answer in one to three complete sentences, including numerical justification.
- Are A and B independent events? Explain your answer in one to three complete sentences, including numerical justification.
- A special deck of cards has ten cards. Four are green, three are blue, and three are red. When a card is picked, its color of it is recorded. An experiment consists of first picking a card and then tossing a coin.
- List the sample space.
- Let A be the event that a blue card is picked first, followed by landing a head on the coin toss. Find P(A).
- Let B be the event that a red or green is picked, followed by landing a head on the coin toss. Are the events A and
B mutually exclusive? Explain your answer in one to three complete sentences, including numerical justification.
- Let C be the event that a red or blue is picked, followed by landing a head on the coin toss. Are the events A and
C mutually exclusive? Explain your answer in one to three complete sentences, including numerical justification.
- An experiment consists of first rolling a die and then tossing a coin.
- List the sample space.
- Let A be the event that either a three or a four is rolled first, followed by landing a head on the coin toss. Find
P(A).
- Let B be the event that the first and second tosses land on heads. Are the events A and B mutually exclusive? Explain your answer in one to three complete sentences, including numerical justification.
- An experiment consists of tossing a nickel, a dime, and a quarter. Of interest is the side the coin lands on.
- List the sample space.
- Let A be the event that there are at least two tails. Find P(A).
- Let B be the event that the first and second tosses land on heads. Are the events A and B mutually exclusive? Explain your answer in one to three complete sentences, including justification.
- Consider the following scenario: Let P(C) = 0.4.
Let P(D) = 0.5. Let P(C | D) = 0.6.
- Find P(C ∩ D).
- Are C and D mutually exclusive? Why or why not?
- Are C and D independent events? Why or why not?
- Find P(C ∪ D).
- Find P(D | C).
- Y and Z are independent events.
- Rewrite the basic Addition Rule P(Y ∪ Z) = P(Y) + P(Z) – P(Y ∩ Z) using the information that Y and Z are
independent events.
- Use the rewritten rule to find P(Z) if P(Y ∪ Z) = 0.71 and P(Y) = 0.42.
- G and H are mutually exclusive events. P(G) = 0.5 P(H) = 0.3
- Explain why the following statement MUST be false: P(H | G) = 0.4.
- Find P(H ∪ G).
- Are G and H independent or dependent events? Explain in a complete sentence.
This OpenStax book is available for free at http://cnx.org/content/col11776/1.33
- Approximately 281,000,000 people over age five live in the United States. Of these people, 55,000,000 speak a language other than English at home. Of those who speak another language at home, 62.3% speak Spanish.
Let: E = speaks English at home; E′ = speaks another language at home; S = speaks Spanish; Finish each probability statement by matching the correct answer.
|
Probability Statements |
Answers |
|
a. P(E′) = |
i. 0.8043 |
|
b. P(E) = |
ii. 0.623 |
|
c. P(S ∩ E′) = |
iii. 0.1957 |
|
d. P(S | E′) = |
iv. 0.1219 |
Table 3.14
- 1994, the U.S. government held a lottery to issue 55,000 Green Cards (permits for non-citizens to work legally in the U.S.). Renate Deutsch, from Germany, was one of approximately 6.5 million people who entered this lottery. Let G = won green card.
- What was Renate’s chance of winning a Green Card? Write your answer as a probability statement.
- In the summer of 1994, Renate received a letter stating she was one of 110,000 finalists chosen. Once the finalists were chosen, assuming that each finalist had an equal chance to win, what was Renate’s chance of winning a Green Card? Write your answer as a conditional probability statement. Let F = was a finalist.
- Are G and F independent or dependent events? Justify your answer numerically and also explain why.
- Are G and F mutually exclusive events? Justify your answer numerically and explain why.
- Three professors at George Washington University did an experiment to determine if economists are more selfish than other people. They dropped 64 stamped, addressed envelopes with $10 cash in different classrooms on the George Washington campus. 44% were returned overall. From the economics classes 56% of the envelopes were returned. From the business, psychology, and history classes 31% were returned.
Let: R = money returned; E = economics classes; O = other classes
- Write a probability statement for the overall percent of money returned.
- Write a probability statement for the percent of money returned out of the economics classes.
- Write a probability statement for the percent of money returned out of the other classes.
- Is money being returned independent of the class? Justify your answer numerically and explain it.
- Based upon this study, do you think that economists are more selfish than other people? Explain why or why not. Include numbers to justify your answer.
- The following table of data obtained from www.baseball-almanac.com shows hit information for four players. Suppose that one hit from the table is randomly selected.
|
Name |
Single |
Double |
Triple |
Home Run |
Total Hits |
|
Babe Ruth |
1,517 |
506 |
136 |
714 |
2,873 |
|
Jackie Robinson |
1,054 |
273 |
54 |
137 |
1,518 |
|
Ty Cobb |
3,603 |
174 |
295 |
114 |
4,189 |
|
Hank Aaron |
2,294 |
624 |
98 |
755 |
3,771 |
|
Total |
8,471 |
1,577 |
583 |
1,720 |
12,351 |
Table 3.15
Are “the hit being made by Hank Aaron” and “the hit being a double” independent events?
- Yes, because P(hit by Hank Aaron | hit is a double) = P(hit by Hank Aaron)
- No, because P(hit by Hank Aaron | hit is a double) ≠ P(hit is a double)
- No, because P(hit is by Hank Aaron | hit is a double) ≠ P(hit by Hank Aaron)
- Yes, because P(hit is by Hank Aaron | hit is a double) = P(hit is a double)
- United Blood Services is a blood bank that serves more than 500 hospitals in 18 states. According to their website, a person with type O blood and a negative Rh factor (Rh-) can donate blood to any person with any bloodtype. Their data show that 43% of people have type O blood and 15% of people have Rh- factor; 52% of people have type O or Rh- factor.
- Find the probability that a person has both type O blood and the Rh- factor.
- Find the probability that a person does NOT have both type O blood and the Rh- factor.
- At a college, 72% of courses have final exams and 46% of courses require research papers. Suppose that 32% of courses have a research paper and a final exam. Let F be the event that a course has a final exam. Let R be the event that a course requires a research paper.
- Find the probability that a course has a final exam or a research project.
- Find the probability that a course has NEITHER of these two requirements.
- In a box of assorted cookies, 36% contain chocolate and 12% contain nuts. Of those, 8% contain both chocolate and nuts. Sean is allergic to both chocolate and nuts.
- Find the probability that a cookie contains chocolate or nuts (he can’t eat it).
- Find the probability that a cookie does not contain chocolate or nuts (he can eat it).
- A college finds that 10% of students have taken a distance learning class and that 40% of students are part time students. Of the part time students, 20% have taken a distance learning class. Let D = event that a student takes a distance learning class and E = event that a student is a part time student
- Find P(D ∩ E).
- Find P(E | D).
- Find P(D ∪ E).
- Using an appropriate test, show whether D and E are independent.
- Using an appropriate test, show whether D and E are mutually exclusive.
Use the information in the Table 3.16 to answer the next eight exercises. The table shows the political party affiliation of each of 67 members of the US Senate in June 2012, and when they are up for reelection.
|
Democratic Party |
Republican Party |
Other |
Total |
|
|
November 2014 |
20 |
13 |
0 |
|
Table 3.16
This OpenStax book is available for free at http://cnx.org/content/col11776/1.33
|
Up for reelection: |
Democratic Party |
Republican Party |
Other |
Total |
|
November 2016 |
10 |
24 |
0 |
|
|
Total |
|
|
|
|
Table 3.16
- What is the probability that a randomly selected senator has an “Other” affiliation?
- What is the probability that a randomly selected senator is up for reelection in November 2016?
- What is the probability that a randomly selected senator is a Democrat and up for reelection in November 2016?
- What is the probability that a randomly selected senator is a Republican or is up for reelection in November 2014?
- Suppose that a member of the US Senate is randomly selected. Given that the randomly selected senator is up for reelection in November 2016, what is the probability that this senator is a Democrat?
- Suppose that a member of the US Senate is randomly selected. What is the probability that the senator is up for reelection in November 2014, knowing that this senator is a Republican?
- The events “Republican” and “Up for reelection in 2016” are
- mutually exclusive.
- independent.
- both mutually exclusive and independent.
- neither mutually exclusive nor independent.
- The events “Other” and “Up for reelection in November 2016” are
- mutually exclusive.
- independent.
- both mutually exclusive and independent.
- neither mutually exclusive nor independent.
- Table 3.17 gives the number of suicides estimated in the U.S. for a recent year by age, race (black or white), and sex. We are interested in possible relationships between age, race, and sex. We will let suicide victims be our population.
|
1–14 |
15–24 |
25–64 |
over 64 |
TOTALS |
|
|
white, male |
210 |
3,360 |
13,610 |
|
22,050 |
|
white, female |
80 |
580 |
3,380 |
|
4,930 |
|
black, male |
10 |
460 |
1,060 |
|
1,670 |
|
black, female |
0 |
40 |
270 |
|
330 |
|
all others |
|
|
|
|
|
|
TOTALS |
310 |
4,650 |
18,780 |
|
29,760 |
Table 3.17
Do not include “all others” for parts f and g.
- Fill in the column for the suicides for individuals over age 64.
- Fill in the row for all other races.
- Find the probability that a randomly selected individual was a white male.
- Find the probability that a randomly selected individual was a black female.
- Find the probability that a randomly selected individual was black
- Find the probability that a randomly selected individual was male.
- Out of the individuals over age 64, find the probability that a randomly selected individual was a black or white male.
Use the following information to answer the next two exercises. The table of data obtained from www.baseball-almanac.com
shows hit information for four well known baseball players. Suppose that one hit from the table is randomly selected.
|
NAME |
Single |
Double |
Triple |
Home Run |
TOTAL HITS |
|
Babe Ruth |
1,517 |
506 |
136 |
714 |
2,873 |
|
Jackie Robinson |
1,054 |
273 |
54 |
137 |
1,518 |
|
Ty Cobb |
3,603 |
174 |
295 |
114 |
4,189 |
|
Hank Aaron |
2,294 |
624 |
98 |
755 |
3,771 |
|
TOTAL |
8,471 |
1,577 |
583 |
1,720 |
12,351 |
Table 3.18
- Find P(hit was made by Babe Ruth). a.1518
2873
b. 2873 12351
c.583
12351
d. 4189 12351
12351
b. 114 1720
c.1720
4189
d. 114
12351
- Table 3.19 identifies a group of children by one of four hair colors, and by type of hair.
|
Brown |
Blond |
Black |
Red |
Totals |
|
|
Wavy |
20 |
|
15 |
3 |
43 |
|
Straight |
80 |
15 |
|
12 |
|
|
Totals |
|
20 |
|
|
215 |
Table 3.19
- Complete the table.
- What is the probability that a randomly selected child will have wavy hair?
- What is the probability that a randomly selected child will have either brown or blond hair?
- What is the probability that a randomly selected child will have wavy brown hair?
- What is the probability that a randomly selected child will have red hair, given that he or she has straight hair?
- If B is the event of a child having brown hair, find the probability of the complement of B.
- In words, what does the complement of B represent?
This OpenStax book is available for free at http://cnx.org/content/col11776/1.33
- In a previous year, the weights of the members of the San Francisco 49ers and the Dallas Cowboys were published in the San Jose Mercury News. The factual data were compiled into the following table.
|
Shirt# |
≤ 210 |
211–250 |
251–290 |
> 290 |
|
1–33 |
21 |
5 |
0 |
0 |
|
34–66 |
6 |
18 |
7 |
4 |
|
66–99 |
6 |
12 |
22 |
5 |
Table 3.20
For the following, suppose that you randomly select one player from the 49ers or Cowboys.
- Find the probability that his shirt number is from 1 to 33.
- Find the probability that he weighs at most 210 pounds.
- Find the probability that his shirt number is from 1 to 33 AND he weighs at most 210 pounds.
- Find the probability that his shirt number is from 1 to 33 OR he weighs at most 210 pounds.
- Find the probability that his shirt number is from 1 to 33 GIVEN that he weighs at most 210 pounds.
Use the following information to answer the next two exercises. This tree diagram shows the tossing of an unfair coin followed by drawing one bead from a cup containing three red (R), four yellow (Y) and five blue (B) beads. For the coin,
P(H) = 2
3
and P(T) = 1
3
where H is heads and T is tails.
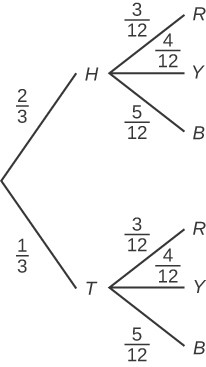
Figure 3.20
- Find P(tossing a Head on the coin AND a Red bead)
2 3
- 5 15
- 6 36
- 5 36
15 36
- 10 36
- 10 12
- 6 36
- A box of cookies contains three chocolate and seven butter cookies. Miguel randomly selects a cookie and eats it. Then he randomly selects another cookie and eats it. (How many cookies did he take?)
- Draw the tree that represents the possibilities for the cookie selections. Write the probabilities along each branch of the tree.
- Are the probabilities for the flavor of the SECOND cookie that Miguel selects independent of his first selection? Explain.
- For each complete path through the tree, write the event it represents and find the probabilities.
- Let S be the event that both cookies selected were the same flavor. Find P(S).
- Let T be the event that the cookies selected were different flavors. Find P(T) by two different methods: by using the complement rule and by using the branches of the tree. Your answers should be the same with both methods.
- Let U be the event that the second cookie selected is a butter cookie. Find P(U).
BRINGING IT TOGETHER: HOMEWORK
- A previous year, the weights of the members of the San Francisco 49ers and the Dallas Cowboys were published in the San Jose Mercury News. The factual data are compiled into Table 3.21.
|
≤ 210 |
211–250 |
251–290 |
290≤ |
|
|
1–33 |
21 |
5 |
0 |
0 |
|
34–66 |
6 |
18 |
7 |
4 |
|
66–99 |
6 |
12 |
22 |
5 |
Table 3.21
For the following, suppose that you randomly select one player from the 49ers or Cowboys.
If having a shirt number from one to 33 and weighing at most 210 pounds were independent events, then what should be true about P(Shirt# 1–33|≤ 210 pounds)?
- The probability that a male develops some form of cancer in his lifetime is 0.4567. The probability that a male has at least one false positive test result (meaning the test comes back for cancer when the man does not have it) is 0.51. Some of the following questions do not have enough information for you to answer them. Write “not enough information” for those answers. Let C = a man develops cancer in his lifetime and P = man has at least one false positive.
- P(C) =
- P(P|C) =
c.P(P|C’) =
d. If a test comes up positive, based upon numerical values, can you assume that man has cancer? Justify numerically and explain why or why not.
125. Given events G and H: P(G) = 0.43; P(H) = 0.26; P(H ∩ G) = 0.14
- Find P(H ∪ G).
- Find the probability of the complement of event (H ∩ G).
- Find the probability of the complement of event (H ∪ G).
This OpenStax book is available for free at http://cnx.org/content/col11776/1.33
126. Given eventsJandK : P(J) = 0.18; P(K) = 0.37; P(J ∪ K) = 0.45
- Find P(J ∩ K).
- Find the probability of the complement of event (J ∩ K).
- Find the probability of the complement of event (J ∩ K).
REFERENCES
“Countries List by Continent.” Worldatlas, 2013. Available online at http://www.worldatlas.com/cntycont.htm (accessed May 2, 2013).
Independent and Mutually Exclusive Events
Lopez, Shane, Preety Sidhu. “U.S. Teachers Love Their Lives, but Struggle in the Workplace.” Gallup Wellbeing, 2013. http://www.gallup.com/poll/161516/teachers-love-lives-struggle-workplace.aspx (accessed May 2, 2013).
Data from Gallup. Available online at www.gallup.com/ (accessed May 2, 2013).
Two Basic Rules of Probability
DiCamillo, Mark, Mervin Field. “The File Poll.” Field Research Corporation. Available online at http://www.field.com/ fieldpollonline/subscribers/Rls2443.pdf (accessed May 2, 2013).
Rider, David, “Ford support plummeting, poll suggests,” The Star, September 14, 2011. Available online at http://www.thestar.com/news/gta/2011/09/14/ford_support_plummeting_poll_suggests.html (accessed May 2, 2013).
“Mayor’s Approval Down.” News Release by Forum Research Inc. Available online at http://www.forumresearch.com/ forms/NewsArchives/NewsReleases/74209_TO_Issues_-
_Mayoral_Approval_%28Forum_Research%29%2820130320%29.pdf (accessed May 2, 2013). “Roulette.” Wikipedia. Available online at http://en.wikipedia.org/wiki/Roulette (accessed May 2, 2013).
Shin, Hyon B., Robert A. Kominski. “Language Use in the United States: 2007.” United States Census Bureau. Available online at http://www.census.gov/hhes/socdemo/language/data/acs/ACS-12.pdf (accessed May 2, 2013).
Data from the Baseball-Almanac, 2013. Available online at www.baseball-almanac.com (accessed May 2, 2013). Data from U.S. Census Bureau.
Data from the Wall Street Journal.
Data from The Roper Center: Public Opinion Archives at the University of Connecticut. Available online at http://www.ropercenter.uconn.edu/ (accessed May 2, 2013).
Data from Field Research Corporation. Available online at www.field.com/fieldpollonline (accessed May 2,2 013).
Contingency Tables and Probability Trees
“Blood Types.” American Red Cross, 2013. Available online at http://www.redcrossblood.org/learn-about-blood/blood- types (accessed May 3, 2013).
Data from the National Center for Health Statistics, part of the United States Department of Health and Human Services. Data from United States Senate. Available online at www.senate.gov (accessed May 2, 2013).
“Human Blood Types.” Unite Blood Services, 2011. Available online at http://www.unitedbloodservices.org/ learnMore.aspx (accessed May 2, 2013).
Haiman, Christopher A., Daniel O. Stram, Lynn R. Wilkens, Malcom C. Pike, Laurence N. Kolonel, Brien E. Henderson, and Loīc Le Marchand. “Ethnic and Racial Differences in the Smoking-Related Risk of Lung Cancer.” The New England Journal of Medicine, 2013. Available online at http://www.nejm.org/doi/full/10.1056/NEJMoa033250 (accessed May 2, 2013).
Samuel, T. M. “Strange Facts about RH Negative Blood.” eHow Health, 2013. Available online at http://www.ehow.com/ facts_5552003_strange-rh-negative-blood.html (accessed May 2, 2013).
“United States: Uniform Crime Report – State Statistics from 1960–2011.” The Disaster Center. Available online at http://www.disastercenter.com/crime/ (accessed May 2, 2013).
Data from Clara County Public H.D. Data from the American Cancer Society.
Data from The Data and Story Library, 1996. Available online at http://lib.stat.cmu.edu/DASL/ (accessed May 2, 2013). Data from the Federal Highway Administration, part of the United States Department of Transportation.
Data from the United States Census Bureau, part of the United States Department of Commerce. Data from USA Today.
“Environment.” The World Bank, 2013. Available online at http://data.worldbank.org/topic/environment (accessed May 2, 2013).
“Search for Datasets.” Roper Center: Public Opinion Archives, University of Connecticut., 2013. Available online at http://www.ropercenter.uconn.edu/data_access/data/search_for_datasets.html (accessed May 2, 2013).
SOLUTIONS
- P(L′) = P(S)
- P(M ∪ S)
- P(F ∩ L)
- P(M | L)
- P(L | M)
- P(S | F)
- P(F | L)
- P(F ∪ L)
- P(M ∩ S)
- P(F)
3 P(N) = 15
42
5 P(C) = 5
42
7 P(G) = 20
= 5 14
= 0.12
= 2
= 0.36
= 0.13
150
9 P(R) = 22
150
15
= 11
75
= 0.15
11 P(O) = 150 – 22 – 38 – 20 – 28 – 26
150
= 16
150
= 8 75
= 0.11
13 P(E) = 47
194
15 P(N) = 23
194
= 0.24
= 0.12
This OpenStax book is available for free at http://cnx.org/content/col11776/1.33
17 P(S) = 12
194
= 6 97
= 0.06
19 13 = 1
524
21 3 = 1
62
= 0.25
= 0.5
8
23 P(R) = 4 = 0.5
25 P(O ∪ H)
27 P(H | I)
29 P(N | O)
31 P(I ∪ N)
33 P(I)
35 The likelihood that an event will occur given that another event has already occurred.
37 1
39 the probability of landing on an even number or a multiple of three
41 P(J) = 0.3
43 P(Q ∩ R) = P(Q)P(R) 0.1 = (0.4)P(R) P(R) = 0.25
45 0.376
47 C | L means, given the person chosen is a Latino Californian, the person is a registered voter who prefers life in prison without parole for a person convicted of first degree murder.
49 L ∩ C is the event that the person chosen is a Latino California registered voter who prefers life without parole over the death penalty for a person convicted of first degree murder.
51 0.6492
53 No, because P(L ∩ C) does not equal 0.
130
55 P(musician is a male ∩ had private instruction) = 15
= 3 26
= 0.12
130
57 P(being a female musician ∩ learning music in school) = 38
= 19
65
= 0.29 P(being a female musician)P(learning
music in school) = ⎛ 72 ⎞⎛ 62 ⎞ = 4, 464
= 1, 116
= 0.26 No, they are not independent because P(being a female
⎝130⎠⎝130⎠16, 900
4, 225
musician ∩ learning music in school) is not equal to P(being a female musician)P(learning music in school).
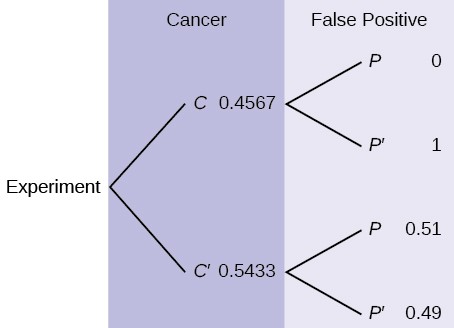
Figure 3.21
60 35,065
100,450
62 To pick one person from the study who is Japanese American AND smokes 21 to 30 cigarettes per day means that the person has to meet both criteria: both Japanese American and smokes 21 to 30 cigarettes. The sample space should include everyone in the study. The probability is 4,715 .
100,450
64 To pick one person from the study who is Japanese American given that person smokes 21-30 cigarettes per day, means that the person must fulfill both criteria and the sample space is reduced to those who smoke 21-30 cigarettes per day. The probability is 4715 .
15,273
This OpenStax book is available for free at http://cnx.org/content/col11776/1.33
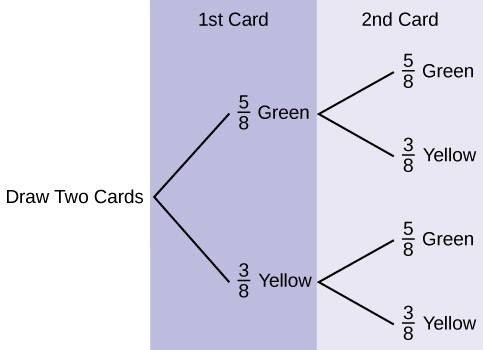 a.
a.
Figure 3.22
b. P(GG) = ⎛5⎞⎛5⎞ = 25
⎝8⎠⎝8⎠64
- P(at least one green) = P(GG) + P(GY) + P(YG) = 25
64
+ 15
64
+ 15
64
= 55
64
- 8
P(G | G) = 5 - Yes, they are independent because the first card is placed back in the bag before the second card is drawn; the composition of cards in the bag remains the same from draw one to draw two.
<2020–64>64TotalsFemale0.02440.39540.06610.486Male0.02590.41860.06950.514Totals0.05030.81400.13561
a.
Table 3.22
b. P(F) = 0.486
c. P(>64 | F) = 0.1361
d. P(>64 and F) = P(F) P(>64|F) = (0.486)(0.1361) = 0.0661
e. P(>64 | F) is the percentage of female drivers who are 65 or older and P(>64 ∩ F) is the percentage of drivers who are female and 65 or older.
f. P(>64) = P(>64 ∩ F) + P(>64 ∩ M) = 0.1356
g. No, being female and 65 or older are not mutually exclusive because they can occur at the same time P(>64 ∩ F) = 0.0661.
Car, Truck or VanWalkPublic TransportationOtherTotalsAlone0.7318Not Alone0.1332Totals0.86500.03900.05300.04301
a.
Table 3.23
- If we assume that all walkers are alone and that none from the other two groups travel alone (which is a big assumption) we have: P(Alone) = 0.7318 + 0.0390 = 0.7708.
- Make the same assumptions as in (b) we have: (0.7708)(1,000) = 771 d. (0.1332)(1,000) = 133
- You can’t calculate the joint probability knowing the probability of both events occurring, which is not in the information given; the probabilities should be multiplied, not added; and probability is never greater than 100%
- A home run by definition is a successful hit, so he has to have at least as many successful hits as home runs.
75 0
77 0.3571
79 0.2142
81 Physician (83.7)
83 83.7 − 79.6 = 4.1
85 P(Occupation < 81.3) = 0.5
a. The Forum Research surveyed 1,046 Torontonians. b. 58%
c. 42% of 1,046 = 439 (rounding to the nearest integer) d. 0.57
e. 0.60.
- P(Betting on two line that touch each other on the table) = 6
38
- P(Betting on three numbers in a line) = 3
38
- P(Bettting on one number) = 1
38
- P(Betting on four number that touch each other to form a square) = 4
38
- P(Betting on two number that touch each other on the table ) = 2
38
f. P(Betting on 0-00-1-2-3) = 5
38
This OpenStax book is available for free at http://cnx.org/content/col11776/1.33
g. P(Betting on 0-1-2; or 0-00-2; or 00-2-3) = 3
38
a. {G1, G2, G3, G4, G5, Y1, Y2, Y3}
5 8
- 2 3
- 2 8
- 6 8
- No, because P(G ∩ E) does not equal 0.
NOTEThe coin toss is independent of the card picked first.
a. {(G,H) (G,T) (B,H) (B,T) (R,H) (R,T)}
b. P(A) = P(blue)P(head) = ⎛ 3 ⎞ ⎛1⎞ = 3
⎝10⎠ ⎝2⎠20
- Yes, A and B are mutually exclusive because they cannot happen at the same time; you cannot pick a card that is both blue and also (red or green). P(A ∩ B) = 0
- 20
No, A and C are not mutually exclusive because they can occur at the same time. In fact, C includes all of the outcomes of A; if the card chosen is blue it is also (red or blue). P(A ∩ C) = P(A) = 3
- S = {(HHH), (HHT), (HTH), (HTT), (THH), (THT), (TTH), (TTT)}
4 8
- Yes, because if A has occurred, it is impossible to obtain two tails. In other words, P(A ∩ B) = 0.
a. If Y and Z are independent, then P(Y ∩ Z) = P(Y)P(Z), so P(Y ∪ Z) = P(Y) + P(Z) – P(Y)P(Z).
b. 0.5
99 iii; i; iv; ii
a. P(R) = 0.44
b. P(R | E) = 0.56
c. P(R | O) = 0.31
- No, whether the money is returned is not independent of which class the money was placed in. There are several ways to justify this mathematically, but one is that the money placed in economics classes is not returned at the same overall rate; P(R | E) ≠ P(R).
- No, this study definitely does not support that notion; in fact, it suggests the opposite. The money placed in the
economics classrooms was returned at a higher rate than the money place in all classes collectively; P(R | E) > P(R).
a. P(type O ∪ Rh-) = P(type O) + P(Rh-) – P(type O ∩ Rh-)
0.52 = 0.43 + 0.15 – P(type O ∩ Rh-); solve to find P(type O ∩ Rh-) = 0.06 6% of people have type O, Rh- blood
b. P(NOT(type O ∩ Rh-)) = 1 – P(type O ∩ Rh-) = 1 – 0.06 = 0.94
94% of people do not have type O, Rh- blood
a. Let C = be the event that the cookie contains chocolate. Let N = the event that the cookie contains nuts. b. P(C ∪ N) = P(C) + P(N) – P(C ∩ N) = 0.36 + 0.12 – 0.08 = 0.40
c. P(NEITHER chocolate NOR nuts) = 1 – P(C ∪ N) = 1 – 0.40 = 0.60
107 0
109 10
67
111 10
34
113 d
Race and Sex1–1415–2425–64over 64TOTALSwhite, male2103,36013,6104,87022,050white, female805803,3808904,930black, male104601,0601401,670black, female04027020330all others100TOTALS3104,65018,7806,02029,760
a.
Table 3.24
Race and Sex1–1415–2425–64over 64TOTALSwhite, male2103,36013,6104,87022,050white, female805803,3808904,930black, male104601,0601401,670black, female04027020330all others10210460100780TOTALS3104,65018,7806,02029,760
b.
Table 3.25
This OpenStax book is available for free at http://cnx.org/content/col11776/1.33
c.22,050
29,760
d. 330
29,760
e.2,000 29,760
f.23,720
29,760
g.5,010
6,020
117 b
a.26 106
b. 33 106
c.21 106
d. ⎛ 26 ⎞ + ⎛ 33 ⎞ – ⎛ 21 ⎞ = ⎛ 38 ⎞
⎝106⎠
e.21 33
121 a
⎝106⎠
⎝106⎠
⎝106⎠
a. P(C) = 0.4567
- not enough information
- not enough information
- No, because over half (0.51) of men have at least one false positive text
a.(J ∪ K) = P( J ) + P(K) − P(J ∩ K); 0.45 = 0.18 + 0.37 − P(J ∩ K); solve to fin P(J ∩ K) = 0.10
b. P(NOT(J ∩ K)) = 1 − P(J ∩ K) = 1 − 0.10 = 0.90
c.P(NOT(J ∪ K)) = 1 − P(J ∪ K) = 1 − 0.45 = 0.55
This OpenStax book is available for free at http://cnx.org/content/col11776/1.33