2 Phylogenetic Systematics in Parasitology
Anindo Choudhury
Connection Between Phylogenetic Systematics, Taxonomy, and Classification: A Review
Every species, whether it is the bacterium Escherichia coli, the malaria-causing Plasmodium falciparum, or the blue whale, Balaenoptera musculus, has a formal, given scientific name. Each name is in 2 parts, and in Latin, hence this formal name is also called the organism’s Latin binomen (bi = 2-part, nomen = name). The first part of this 2-part name is the genus of the organism (for example, Plasmodium) and the second one, the specific or species name (for example, falciparum). However, it is conventional (and important) to use both parts of the scientific name (for example, P. falciparum), together when referring to the species. Because these names are in Latin, it is also conventional to italicize the scientific name in print or underline them when they are hand-written. The practice of giving each organism a formal name is taxonomy and relies on a set of methods.
Taxonomy goes hand in hand with, and is part of, a related scientific practice of placing organisms into formally named sets using a hierarchical system. This system of grouping, familiar to all of us since our biology classes in high school (Figure 1a), is classification. Early naturalists placed organisms that broadly shared common features first in larger groups and then ones that shared a smaller subset of features into progressively smaller groups, so there could be some order in describing and cataloging the vast diversity of life on Earth. A common formal classification scheme was devised (Figure 1a) and originally began with the category kingdom. It is a scheme that we follow to this day. Deciding what to name a species (taxonomy) when describing it for the first time or revising/changing the name depends on correctly classifying that organism. The ranks or categories of classification called the genus and species come at the very end of formal classification (Figure 1a). Here are examples of 2 species, the human broad tapeworm (Dibothriocephalus latus) (Figure 1b) and humans (Homo sapiens) (Figure 1c), formally classified.
Between these major categories or ranks (kingdom, phylum, class, order, family, genus, and species), taxonomists created subgroups to further fine-tune the classification. Examples of other categories are ranks such as subphylum, lower in rank than phylum but higher than class, or suborder, lower in rank than order but higher than family. In other words, a phylum could contain several subphyla, each with their own set of classes, and orders with their own set of suborders, etc. Note that this does not change the actual hierarchical nature of the classification but refines it. For example, the phylum Chordata is subdivided into 3 subphyla; 1 subphylum is the very familiar Vertebrata (vertebrates, a group to which we humans belong). The word vertebrate is used more often than the word chordate (for the phylum Chordata) because the other non-vertebrate chordates are rarely encountered in nature.
Taxonomy and classification fall under a broader branch of science called systematics, and scientists engaged in this research are called systematists. The following sections will include a brief review how systematics developed and flourished in the 20th century, and what impact it had on parasitology.
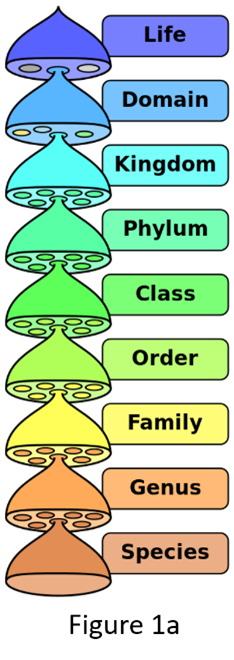
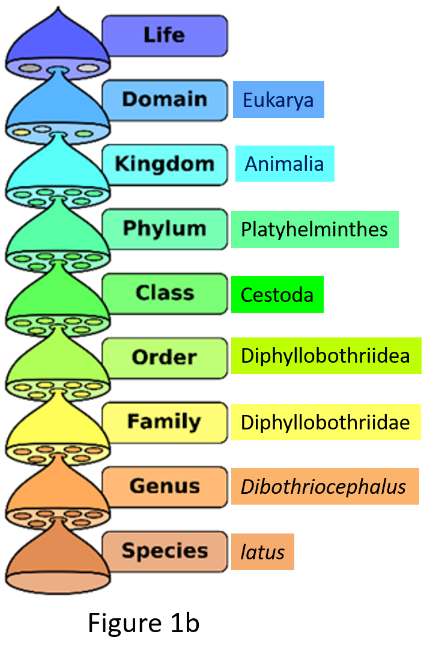
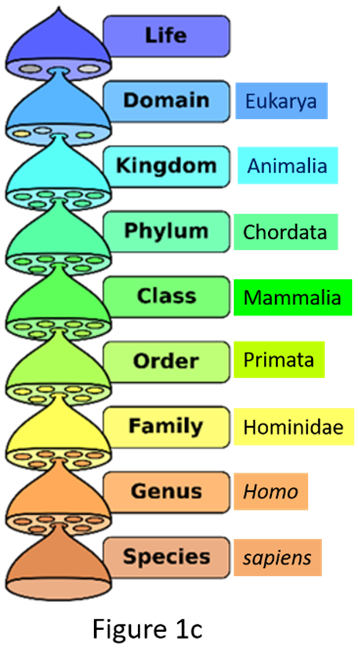
Figure 1. Names of taxonomic classification of organisms.
(Source: Adapted from P. Halasz, 2007. License: CC BY-SA 4.0 International.)
Cultivating a Deeper Understanding
What does classification—the formal grouping of organisms—imply and what methods are used to classify and place organisms in their correct groups and give them their appropriate scientific names?
Before scientists knew about evolution and genetics, organisms were classified based on their similarities. More common and general similarities were used for higher ranks or categories (for example, phylum) and similarities that were more limited to particular groups were used for lower ranks, such as class. For example, naturalists and anatomists noted that a large group of animals, including lampreys, jawed fishes, amphibians, lizards, snakes, turtles, mammals, birds, crocodilians, and even varieties of extinct fossil animals such as dinosaurs, pterosaurs, and others, possessed a stiff rod-like structure in their backs. Anatomists proposed that this structure, called the notochord or its modified version, a bony vertebral column, could be used as a unifying feature to group all organisms that possessed it, so they established the phylum Chordata (chordates). For chordates that possessed a bony spine, the vertebral column, they established the subphylum Vertebrata (vertebrates) to distinguish them at the time from chordates such as hagfish and lampreys that only had an unmodified notochord, which they considered primitive. The notion that some organisms and their features were ancient or primitive was well established because of the fossil record and the work of paleontologists. Naturalists also noted that only a subset of vertebrates possessed hair and mammary glands, so they grouped the ones that did into the next available lower taxonomic category, class, and named them Mammalia (mammals). Similarly, only a subset of vertebrates, birds, possess feathers, so for those vertebrates, naturalists established the formal class Aves. They also did this for amphibians (class Amphibia) and reptiles (class Reptilia). It is worth noting, albeit obviously, that naturalists were basing their classification on comparative anatomy.
Soon after formal classification was established in the 18th century, naturalists began thinking about the diversity of life on Earth as the product of evolution. Evolution proposed that all natural kinds of organisms–species–originated from previously existing natural kinds by modification, which led to the inevitable conclusion that all of life on Earth is related in the form of a giant family tree. As a result, taxonomists recognized that similarity among species was because of evolutionary relatedness. In other words, evolution provided, and for the first time, a unifying basis for understanding why species were more or less similar to one another.
Once evolutionary biology became widely accepted as the unifying theory in biology, taxonomists strove to produce natural classifications, that is, classifications that reflected the evolutionary, or genealogical, relationships of organisms. What this meant for the formal classification scheme (Figure 1a) was that when taxonomists examined the existing classification of species, or placed organisms they were discovering and describing in a particular class or family or genus, they needed to be reasonably confident that the placement reflected the evolutionary relationships of the species in question.
For several decades since the widespread acceptance of evolution in the early 1900s, taxonomists continued to use a combination of anatomical features, often newly discovered ones, to propose or revise the existing classifications of a wide range of organisms. Nevertheless, the practice suffered from the lack of a clear and objective methodology that could challenge or supplant the expert opinions and assertions made by leading taxonomists and systematists of the time. In other words, there was no consistent method of producing new classifications or testing existing ones. This problem was true for higher classifications, whether a species belonged to a particular order or family, as well as for lower-level classification, for example deciding whether a species belonged in one genus or another.
In 1963, Robert R. Sokal and Peter H. A. Sneath provided the first detailed objective method: Numerical taxonomy. In this once widely-used method, taxonomists tabulated data from as many morphological features of the species they were studying as they could and then analyzed those data using a particular mathematical algorithm (a set of computational rules). This was akin to a cluster analysis, whereby species sharing the greatest number of characteristics would be grouped together. In other words, the method produced groupings based on overall similarity. The method in which groupings of species was based on such overall similarity came to be known as phenetics. The method had the advantage that both data and analyses were explicit, and hence, repeatable. Furthermore, the analyses could be improved by adding more data.
Phylogenetic Systematics
German entomologist Willi Hennig developed a fundamentally different method, called phylogenetic systematics, first published in German in 1950. Once it was translated into English in 1966 and became more widely accessible, it fundamentally transformed the practice of systematics, including how taxonomy and classification are practiced. Describing Hennig’s approach, Brooks (1985), who first introduced phylogenetic systematics to parasitology, put it succinctly (emphases and word in brackets added):
[Hennig] asserted that all species are composites of ancestral and derived traits; therefore, there are no such things as archetypes that, by definition, are all-primitive. This assertion led directly to Hennig’s proposed methodology. If the traits exhibited by any species are a combination of primitive and derived features, then the traits shared by two or more species will be indicators of phylogenetic relationship. Shared primitive traits indicate general phylogenetic relationships while shared derived traits indicate more particular phylogenetic relationships. Two species that share a derived trait or traits that are unique to them are each other’s closest relatives.
The idea in the last sentence from Brooks (1985) can also be applied to any taxon, whether it is a species or genus or any rank higher than that. For example, if 2 genera share a derived trait unique to them, the genera are each other’s closest relatives.
In the technical language of phylogenetic systematics, relatively primitive or ancestral traits are called plesiomorphies (singular: plesiomorphy) or plesiomorphic traits, whereas relatively derived, that is, more recently evolved traits, are called apomorphies (singular: apomorphy) or apomorphic traits. Shared plesiomorphic traits are called symplesiomorphies, whereas shared derived traits are called synapomorphies. In phylogenetic systematics, synapomorphies are all important, and finding synapomorphies is a critical step in discovering true relationships among taxa.
The effect of phylogenetic systematics on classification was profound. Henceforth, valid natural groups could only be recognized or diagnosed by their synapomorphies, not by shared plesiomorphy. For example, if we want to examine the relationships among tetrapods, then the vertebral column is not a useful trait because all tetrapods have one, so it can’t be used to distinguish some tetrapods from others. The vertebral column is a plesiomorphic trait for tetrapods. It is plesiomorphic because the common ancestor of tetrapods possessed this feature. Similarly, the presence of 4 limbs with digits is also not useful when trying to find out which tetrapods are related to which others either because the condition of having 4 limbs with digits is the ancestral tetrapod condition. On the other hand, an amniotic egg, found only in a subset of tetrapods, is a relatively more recently evolved type of egg compared to the ancestral egg of tetrapods that did not have an amnion surrounding the developing embryo. So, an amniotic egg can be used as a synapomorphy to relate mammals and sauropsids (birds, crocodilians, lizards, snakes, and turtles). Going a step further, within this amniote group, only a subset of amniotes have hair and mammary glands. Hair and mammary glands must then have evolved after the amniotic egg, and so can be used as synapomorphies for this group called mammals. Using phylogenetic systematics, the evolutionary relationships of the major groups of vertebrates can be depicted in the form of a branching diagram or phylogenetic tree and the synapomorphies placed on it (Figure 2).
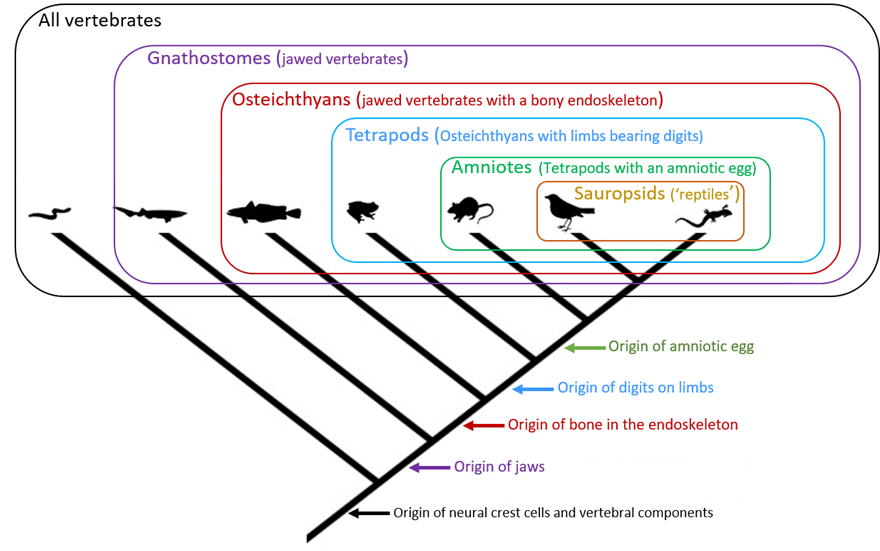
Figure 2. Basic phylogenetic tree of vertebrates.
(Snake image source: S. Stone, ca. 1789–1790, from the State Library of New South Wales, Australia. Public domain. Shark image source: P. S. Foresman, 2020. Public domain. Fish image source: Mrmw, 2021. Public domain. Frog image source: Z. Thompson, 1842. Public domain. Mouse image source: Gwilz, 2013. License: CC BY-SA 4.0. Bird image source: P. S. Foreman, 2020. Public domain. Lizard image source: J. de Graag, 1954. Public domain.)
In this phylogenetic tree (Figure 2), each group that is diagnosed by at least 1 synapomorphy is called a monophyletic group, often referred to as a clade. Thus, amniotes form a monophyletic group, comprising the common ancestor of all amniotes and all of the group’s descendants. The clade amniotes is nested within a larger clade, the tetrapods, which in turn is nested within an even larger clade, the osteichthyans, and so on. Note the hierarchical nature of the relationship; there are groups within groups. This hierarchical relationship can be used to develop natural classifications, that is, classifications that reflect evolutionary relationships rather than arbitrary criteria or overall similarity.
What this foregoing example also illustrates is that every species, indeed every organism, is a mixture of very ancient anatomical (and biochemical) features, some that are not so ancient, and others that are quite recent. Humans, Homo sapiens, are able to produce collagen, a trait that is shared by every animal, including sponges. Collagen production actually defines what it means to be an animal; and, as such, it is one of humans’ oldest traits. Humans’ bony spine is ancient too, but not as ancient as our ability to produce collagen. Human jaws are also ancient, but not as ancient as the spine. Humans’ 4 limbs with digits (fingers and toes) are also old, but not as old as the jaws that arose in distant ancestors some 450 million years ago. Human hair is a relative newcomer, only about 135 million years old. Humans’ opposable thumb is much more recent, perhaps only about 2 million years old, and humans developed the ability for speech and, subsequently, language less than 200,000 years ago. These (and many other) traits can be ordered, ranging from the most ancient (earliest evolved; also called plesiomorphic) to the most recently evolved (apomorphic) as follows:
Collagen → vertebral column → jaws → limbs with digits → hair → opposable thumb → speech/language
Notice, too, that any feature/trait can be plesiomorphic or apomorphic relative to another feature/trait in this ordered series. For example, jaws are apomorphic relative to the vertebral column, but plesiomorphic relative to the tetrapod limb. Understanding the order of traits is an important part of phylogenetic thinking and practice. A word of caution here; sometimes the same traits/features may evolve independently in species that are distantly related by convergent evolution. These instances can be confusing; ornithischian dinosaurs have hip bones like those of birds hence the name Ornithischia (from the Greek ornith = of a bird). But birds share a greater number of synapomorphies with the theropod dinosaurs even though those dinosaurs have a hip that is unspecialized and is unlike that of birds and ornithischians. Therefore, the phylogeny of birds places them with theropod dinosaurs rather than with ornithischians.
There are online resources that provide useful overviews of phylogenetic systematics and related topics. The University of California, Berkeley hosts one such easily accessible and user-friendly resource, available at https://evolution.berkeley.edu/evolibrary/article/phylogenetics_01.
With advances in biotechnology and the ability to obtain DNA (deoxyribonucleic acid) and amino acid sequences, a new and rich source of data has become available. In molecular datasets, individual bases (nucleotides) or amino acids serve as characters and changes in these components (bases or amino acids) are conceptually treated in the same way as changes in morphological characters. These data can thus be used for phylogenetic analyses. Molecular phylogenetics has now superseded morphology-based phylogenetic systematics in most areas, with the obvious exception of paleontology. Although both morphological and molecular data can be combined in an analysis, molecular data by their very nature (hundreds or thousands of bases or amino acids as characters) vastly outnumber morphological data.
Methods for Constructing Phylogenetic Trees
Several methods are currently used to analyze the relationships of taxa. These include Neighbor Joining (NJ), Maximum Parsimony (MP), Maximum Likelihood (ML), and Bayesian Inference (BI). Each method has its own set of assumptions. Neighbor Joining is considered a phenetic method by many because it uses a distance matrix of characters, and although computationally fast, is often inaccurate. It serves as an adequate first pass in an analysis and can be used in an exploratory manner, but has been supplanted by other, more powerful phylogenetic methods. Maximum Parsimony was originally developed for morphological data and is the oldest of the true phylogenetic methods. It is still preferred by some systematists on philosophical grounds. Maximum Parsimony uses an age-old principle in science–Occam’s razor–whereby the tree that requires the least number of steps, that is, the fewest evolutionary changes, is the preferred phylogeny. Whereas MP makes fewer assumptions than other, probability-based methods that followed, it has been shown to have limitations in certain circumstances. Currently, probabilistic methods, such as ML and BI, are more commonly used to infer phylogenies. Of the several books available, Hall’s (2018) book makes phylogenetic analyses accessible to all biologists by combining the basic theory of the methods mentioned above with a stepwise guide to doing basic analyses with a user friendly and popular phylogenetics software package, MEGA 7.
Reading a Phylogenetic Tree
Consider the phylogenetic tree in Figure 3 that shows the relationships of the 2 species of human lice Pediculus humanus and Pthirus pubis (modified from Reed et al., 2007).
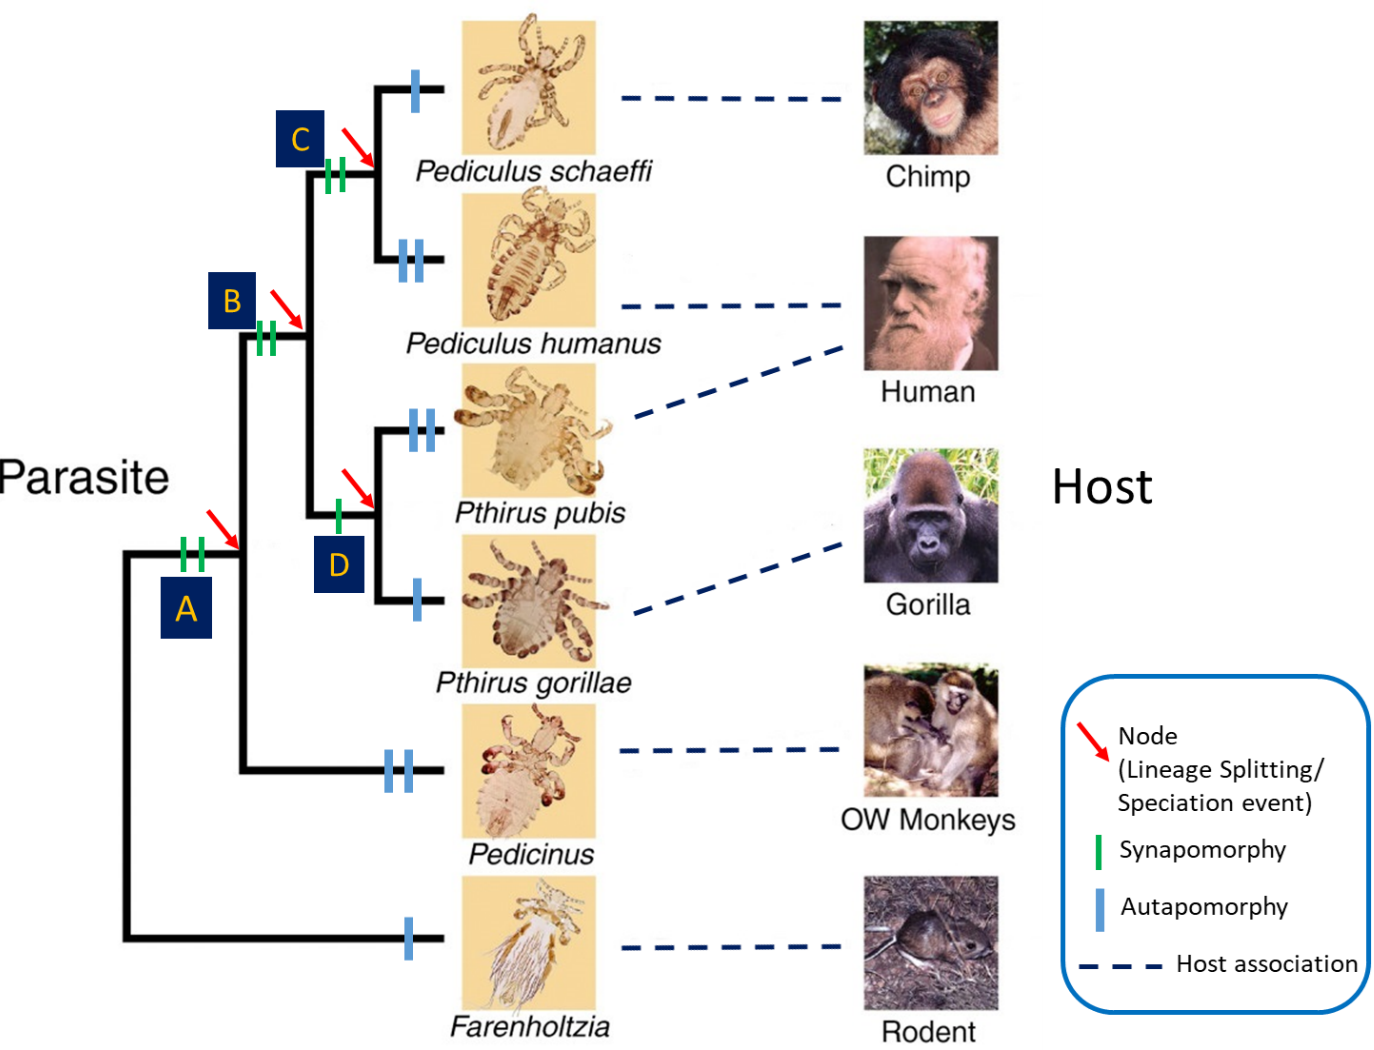
Figure 3. Phylogenetic tree for primate lice and their vertebrate hosts showing nodes, synapomorphies, autapomorphies, and host associations. The number of lines shows the number of synapomorphies and autapomorphies.
(Source: Adapted from Reed at al. 2004; 2007. Photo credits: J. W. Demastes, T. Choe, and V. Smith, 2004. License: CC BY 2.0.)
This tree was generated by Reed and his colleagues (2004; 2007) who analyzed a combined dataset of DNA sequences of genes for cytochrome c oxidase subunit 1 (cox1) and cytochrome b (cytb). What do the various parts of the tree mean? First, locate the taxa (in this case species of lice) placed terminally at the end of the branches. The branching pattern reveals the relationships among these lice species. Pediculus humanus is most closely related to Pe. schaeffi from chimpanzees. Because Pe. humanus and Pe. schaeffi are each other’s closest relatives, they are called sister species. Pthirus pubis is most closely related to Pt. gorillae from gorillas, so they are sister species as well. The red arrows point to the nodes of the tree. Nodes signify the splitting of the ancestral lineage into 2 daughter lineages, and in this tree denote the speciation events that produced the daughter species. The green bars on the internodes denote the synapomorphies based on which the relationships are established. Blue bars on the branches denote apomorphic features unique to each species; such traits are called autapomorphies (plural; singular autapomorphy) and are useful for diagnosing or identifying individual species but are not useful for uncovering relationships (recall that only synapomorphies can reveal relationships; see Figure 4). The letters A, B, C, and D are the ancestors of their daughter lineages or species. This is where we have to be cautious in our interpretation. C is the ancestor of Pediculus schaeffi and Pe. humanus. D is the ancestor of Pt. pubis and Pt. gorillae. B is the common ancestor of C and D. Going down to the base of the tree, one finds A, the common ancestor of B and the lineage that produced the genus Pedicinus in Old World monkeys. Another genus of lice, Farenholzia, found in rodents, serves as the outgroup to the group of lice being analyzed (the ingroup). The outgroup is used to root the tree, which is used to establish the order of change in the characters used in the analysis. The relative position of the different branches of the tree produce the tree’s topology or shape. Note that this phylogenetic analysis indicates that Pe. humanus and Pt. pubis, are not each other’s closest relatives, even though they are both found in humans.
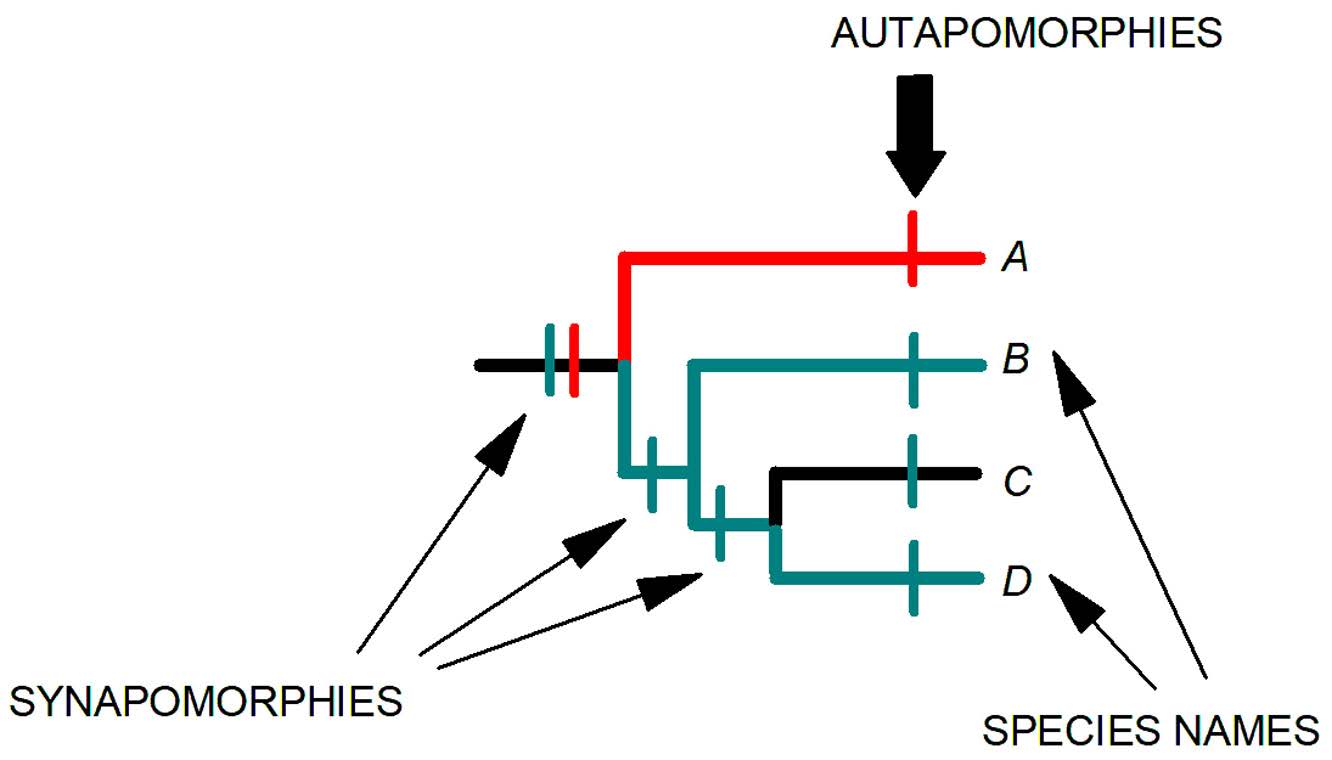
Figure 4. A phylogenetic tree showing distribution of characters. Characters that are shared by species are called synapomorphies (meaning, shared derived characters). A character that occurs only in 1 species is called an autapomorphy, which, more generally speaking, is a trait that is unique to a taxon.
(Source: S. L. Gardner, HWML. License: CC BY.)
Further Applications of Phylogenetic Systematics in Parasitology: Some Examples
Phylogenetic systematics can change our understanding of parasite relationships. Consider the case of the parasitic flatworms; they are grouped into 3 classes: Trematoda, Monogenea, and Cestoda. For much of the 20th century, and despite some opinions to the contrary, the monogeneans were considered trematodes. However, molecular phylogenetics indicated that the monogeneans are actually more closely related to cestodes than to trematodes, which in retrospect was suggested by the presence of the cercomer, a larval structure that some considered homologous to the monogenean haptor (see Figure 5). A multi-gene phylogenetic analysis (Laumer et al., 2015) corroborates the inference that all parasitic trematodes had a common ancestor and that monogeneans are likely more closely related to cestodes, but they found weaker support for the Cercomeromorpha than previous analyses suggested (see Figure 6). Laumer and colleagues (2015) also found that, as was previously proposed, parasitism evolved once in the flatworms and that all parasitic flatworms had a common ancestor.
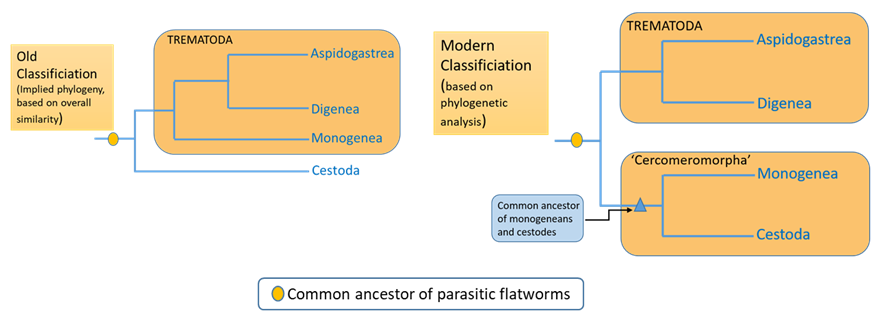
Figure 5. Cladograms showing the common ancestor of parasitic trematodes (flatworms) under an old classification and under a more modern classification.
(Source: A. Choudhury, 2019. License: CC BY-NC-SA 4.0.)
Several conclusions can be drawn from this tree: 1) The parasitic flatworms form a strongly supported clade called the Neodermata, that is, the 3 groups of parasitic flatworms had a common ancestor in the distant past, 2) the Neodermata is a relatively late branching (recently evolved) clade of flatworms and sister to the free living Bothrioplanida, 3) the tapeworms and monogeneans form a clade called the Cercomeromorpha, and are therefore are more closely related to each other than either of them is to the Trematoda.
As methods improve and become more rigorous and sophisticated, phylogenetic reconstructions/hypotheses change and become arguably more robust. Let us examine how this happened using the case of a group of blood cell infecting parasitic organisms, the haemosporidians, that includes the human malarial parasites. In other words, a question that arises is: What are the relationships of the human malarial parasites, Plasmodium falciparum, P. knowlesi, P. malariae, P. ovale, and P. vivax, and has that understanding changed over time?
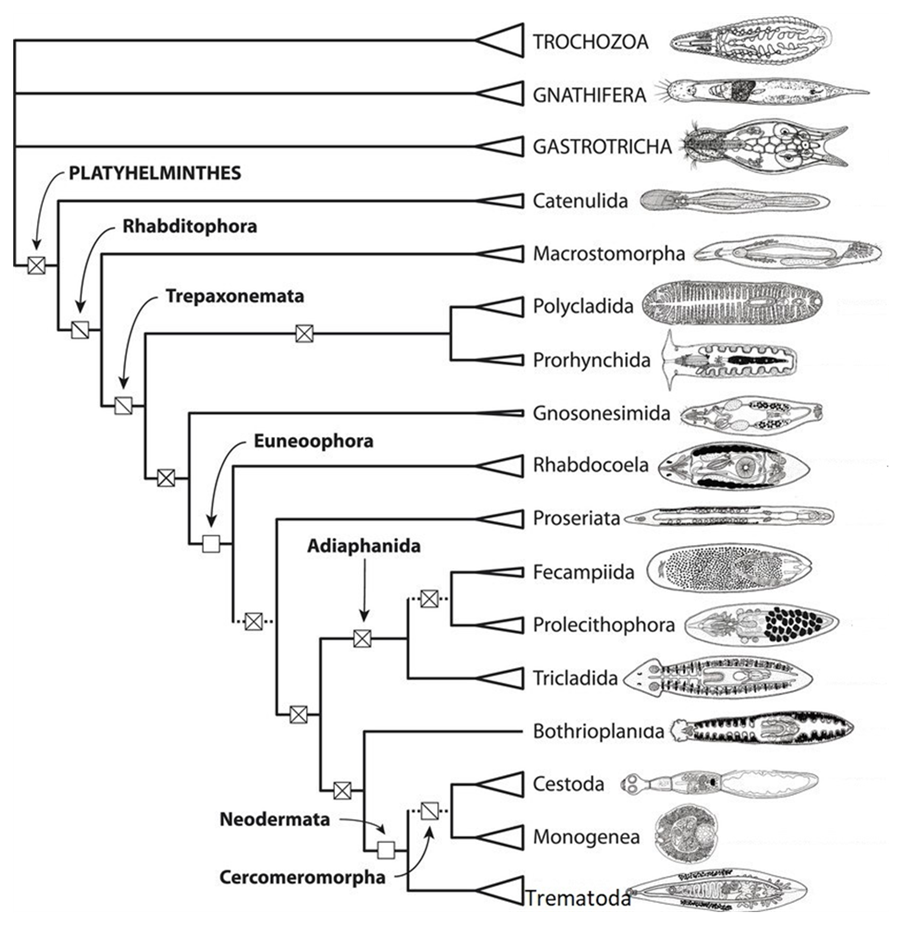
Figure 6. A multi-gene phylogenetic analysis by Laumer and others (2015) corroborates the inference that all parasitic trematodes had a common ancestor and that monogeneans are likely more closely related to cestodes, but they found weaker support for the Cercomeromorpha than previous analyses suggested.
(Source: Laumer et al., 2015. License: CC BY.)
One of the early studies on phylogenetic relationships of Plasmodium spp. was by Escalante and colleagues (1998) who used the Neighbor Joining (NJ) method to analyze sequences of the cytochrome b gene. They found that the 5 human infecting malarial species did not form a clade by themselves; instead, these species were in different parts of the tree (Figure 7). This suggested that humans became hosts of Plasmodium at different times in the evolutionary history of these parasites. In addition, there is strong nodal (statistical) support for the relationship of P. falciparum and P. reichenowi, statistically unsupported evidence of a sister relationship between P. malariae and P. ovale, and for a well-supported clade that contains P. knowlesi and P. vivax, as well as with 8 other species that infect a variety of other animals. The analysis also shows that an unknown species of Hepatocystis falls within a clade of Plasmodium spp.
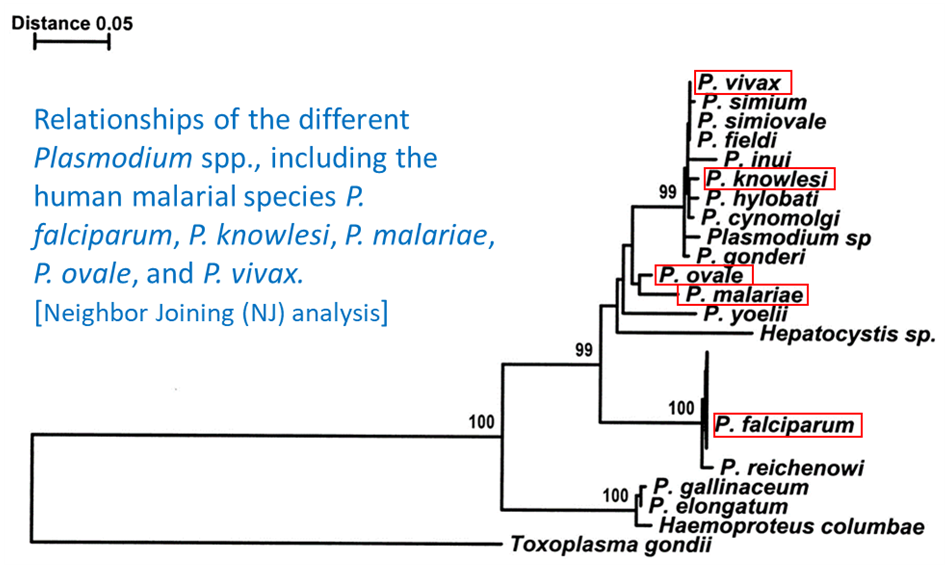
Figure 7. Relationships of the different Plasmodium spp., including the human malarial species P. falciparum, P. knowlesi, P. malariae, P. ovale, and P. vivax. Neighbor joining (NJ) analysis.
(Source: Escalante et al., 1998. Public domain.)
The tree generated by Escalante and colleagues (1998) may be compared with a more recent, large, multigene study of human malarial species, using a maximum likelihood (ML) approach (Rutledge et al., 2017; see Figure 8). First, note that there is a difference in the number of species used in the 2 studies. Several species present in the earlier study by Escalante and colleagues (1998) are absent in this more recent analysis. Having different species in various analyses is not unusual when different datasets are used; not all species may have been available and the focus of the studies are different. Nevertheless, all of the human malarial species and several other species are present, which allows us to compare the interrelationships of the human Plasmodium species in the two studies.
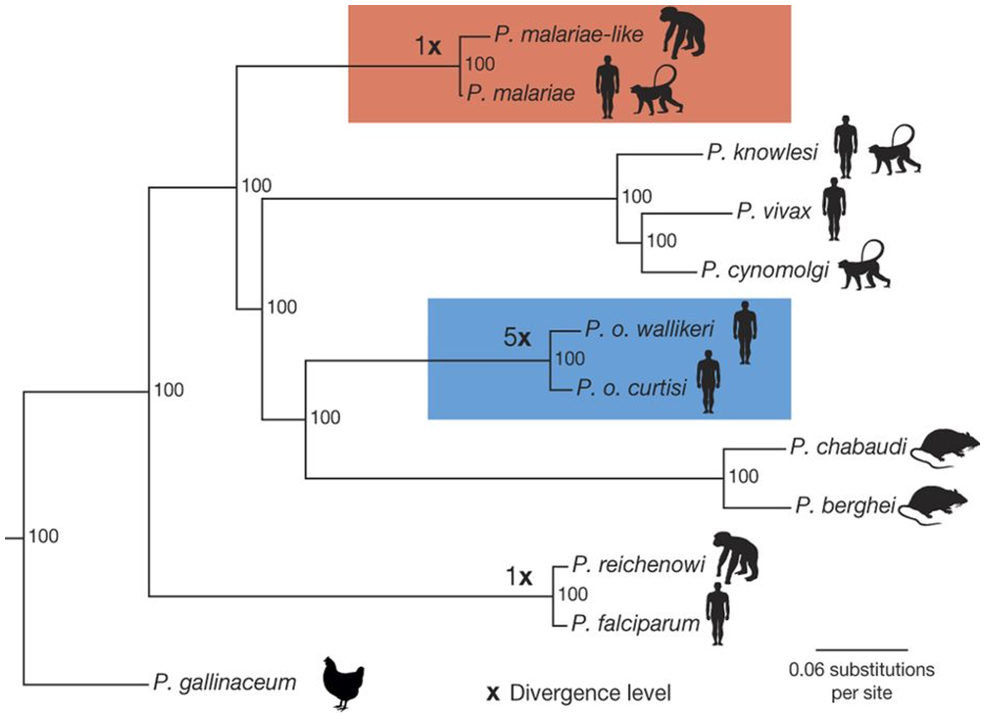
Figure 8. The more sophisticated phylogenetic method used by Rutledge and others (2017) compared to the one employed in the study by Escalante and others (1998) has resulted in a better (meaning, more robust) tree with very high nodal support for the clades.
(Source: Rutledge et al., 1998. License: CC BY 4.0.)
Two clades are highlighted with colors, the Plasmodium malariae clade in red and the P. ovale clade in blue. The P. ovale clade contains the 2 subspecies of P. ovale and the P. malariae clade contains an additional form (possibly species) that the researchers uncovered in their analysis. Note that the human malarial species are in different clades. In several aspects this tree is similar in topology to the one by Escalante and others (1998): 1) The human malarial species don’t form an exclusive clade by themselves but are spread across the tree in different clades, 2) P. falciparum is closely related to P. reichenowi, and 3) P. vivax and P. knowlesi are in the same clade. A notable difference is the relationship between P. malariae and P. ovale, although note that the node showing the relationship of these 2 species in the NJ tree by Escalante and colleagues (1998) has no statistical nodal support. The more sophisticated phylogenetic method used by Rutledge et al. (2017) has resulted in a better (meaning, more robust) tree with very high nodal support for the clades.
Rutledge and others (2017) also used a molecular clock model to estimate the divergence levels of the species as calibrated to the Plasmodium falciparum and P. reichenowi split (×). They used a previously published date of 3.0–5.5 Ma (= million years ago) for the P. falciparum and P. reichenowi split. Calibrating the other splits to this date, they dated the P. ovale split to 20.3 Ma and the P. malariae split to 3.5 Ma. Cartoon silhouettes show the typical hosts of the different species.
Galen and others (2018) improved upon previous studies. They analyzed a combined dataset of sequences from 21 protein coding nuclear genes and produced a comprehensive phylogenetic analysis of haemosporidians (see Figure 9). How should the tree be interpreted? Does it change the relationships of human malaria causing Plasmodium spp. inferred from previous analyses?
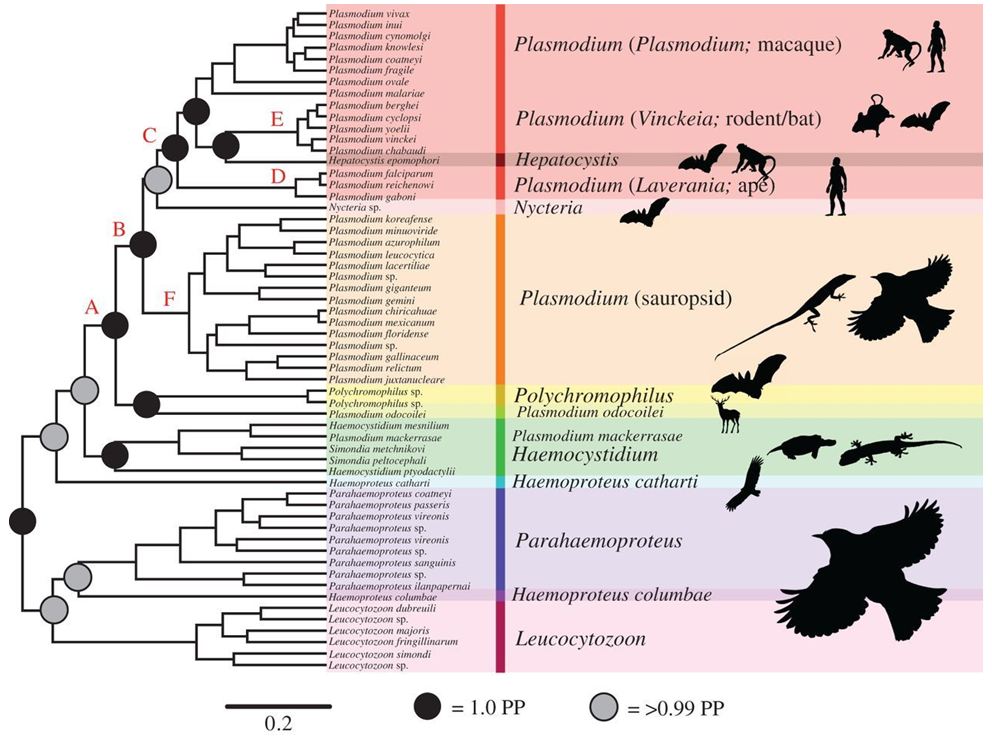
Figure 9. This is the favored haemosporidian phylogeny according to Galen and colleagues (2018). Shown as silhouettes are representatives of the vertebrate host group for each haemosporidian lineage.
(Source: Galen et al., 2018. License: CC BY 4.0.)
If the tree generated by Galen and colleagues (2018) is compared with the tree of Rutledge and others (2017), it is evident that the branching relationships of the human Plasmodium spp. are generally consistent. Plasmodium falciparum is related to P. reichenowi, a relationship that appears in both Escalante and others (1998) and Rutledge and colleagues (2017). Thus, it appears that P. falciparum had a very separate origin than the other human Plasmodium species. Plasmodium vivax and P. knowlesi still belong to the same clade, albeit without strong support, which corroborates both previous studies. However, this tree goes far beyond analyzing the relationships of the human malarial species. By analyzing all the known haemosporidians, the authors have provided a tantalizing deep historical view of these parasites. It appears that the original ancestral hosts of the haemosporidians are birds (and other sauropsids) of the past.
Coevolution and Host Shifting (Host Switching)
One of the fundamental questions that parasitologists often ask is: How did a particular species of parasite come to be associated with a particular species of host? For example, how did humans become hosts of their 2 louse species, Pediculus humanus and Pthirus pubis? Comparing the phylogenies of the lice and humans allows exploration of that question. The example shown in Figure 10 is taken from the work of Reed and colleagues (2007). Note that Janzen (1985) considered a more strict definition of coevolution to be reciprocal evolution of host and parasite.
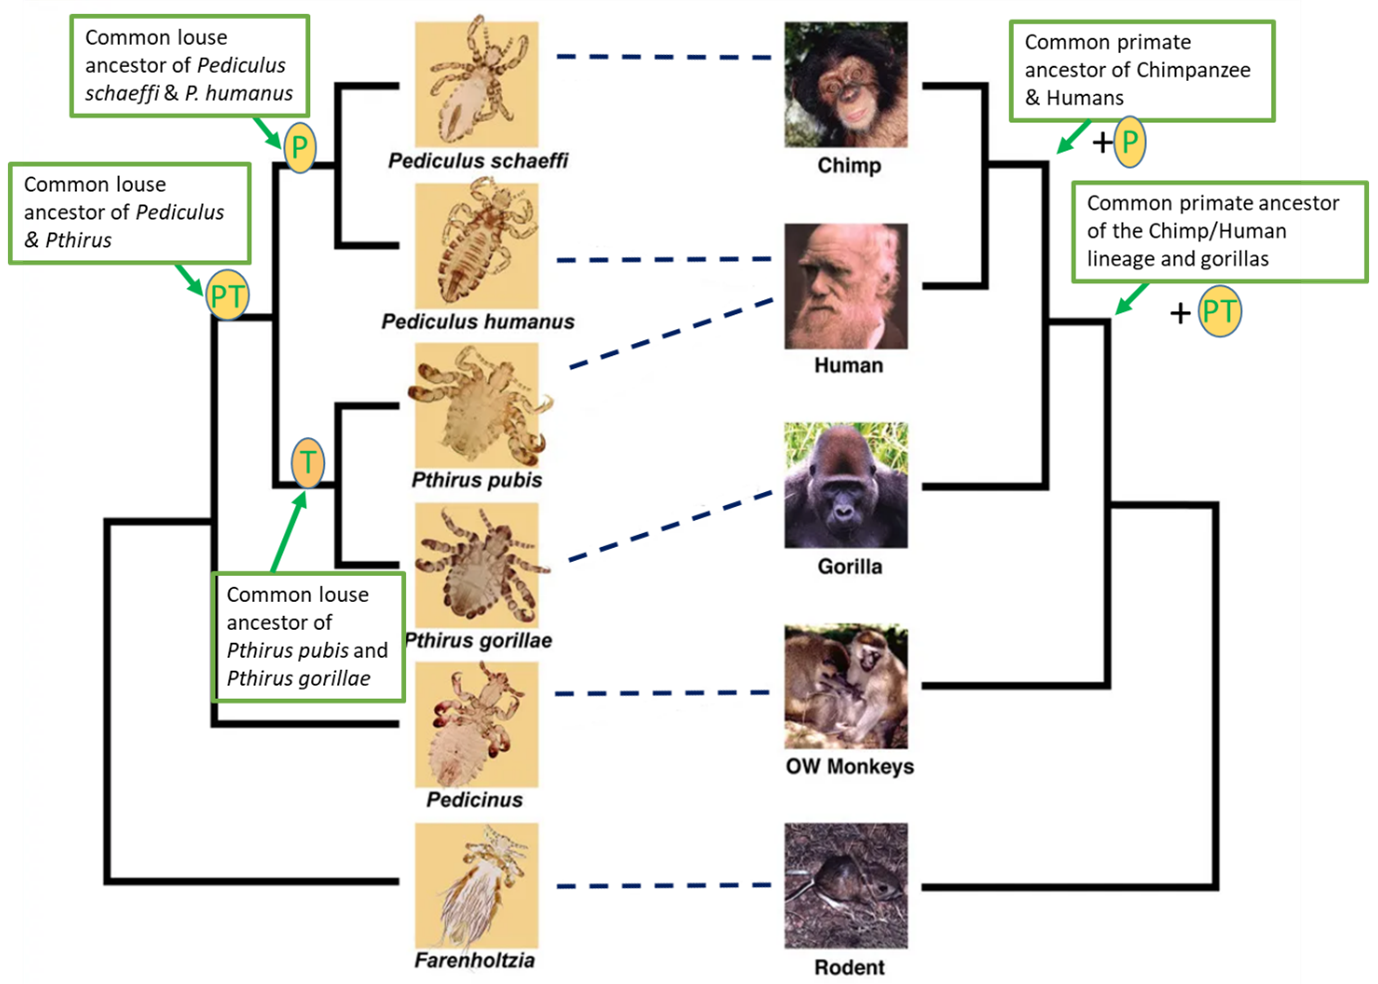
Figure 10. Phylogenetic trees for primate lice and their vertebrate hosts. Trees shown as a cladogram with no branch length information and based on molecular and morphological data. Dashed lines represent host-parasite associations. Humans are unique in being parasitized by 2 genera (Pediculus and Pthirus).
(Source: Adapted from Reed at al., 2007. Photo credits: J. W. Demastes, T. Choe, and V. Smith, 2004. License: CC BY 2.0.)
When comparing the phylogeny of the lice (on the left) with the phylogeny of their primate hosts (on the right), there is a congruence (topological similarity) between portions of the louse phylogeny and the primate host phylogeny. This suggests that the parasites evolved along with their hosts; this is considered by some researchers to represent coevolution. For example, the 2 sister species of Pediculus occur on hosts (chimps and humans) that are also each other’s closest relatives. Logically, it may be inferred that the common ancestor P of the 2 Pediculus sister species was present in the common ancestor of chimps and humans. This type of coevolution, where there is a tight congruence between parasite and host phylogeny, that is, where the parasite phylogeny mirrors the host phylogeny, is called cospeciation. Similarly, by further comparing the phylogenies of the louse and primate hosts, we can infer that because the genus Pediculus is sister to the genus Pthirus, the common louse ancestor PT of Pediculus and Pthirus must have occurred in the common primate ancestor of the chimp-human lineage and gorillas. However, upon further scrutiny, it becomes evident that there is an incongruence between the phylogeny of the 2 species of Pthirus and their hosts. Pt. gorillae is a gorilla parasite and Pt. pubis is a human parasite, but the gorilla and humans are not sister host species, while chimps and humans are. So, while the 2 species of Pediculus show cospeciation, the 2 species of Pthirus do not. How could this have happened? What is the explanation for the current associations of the 2 species of Pthirus in gorillas and humans?
There are 2 explanations for the association of Pthirus lice. In order to understand the alternate explanations, it will help to first simplify the trees and superimpose the louse and primate host phylogenies (Figure 11).
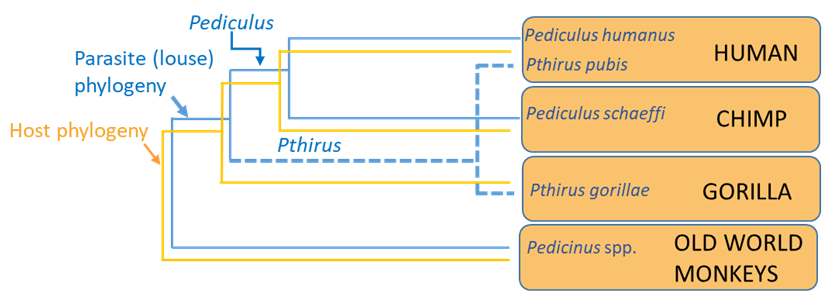
Figure 11. A simplification of the trees with the superimposition of the louse and primate host phylogenies.
(Source: A. Choudhury, 2019. License: CC BY-NC-SA 4.0.)
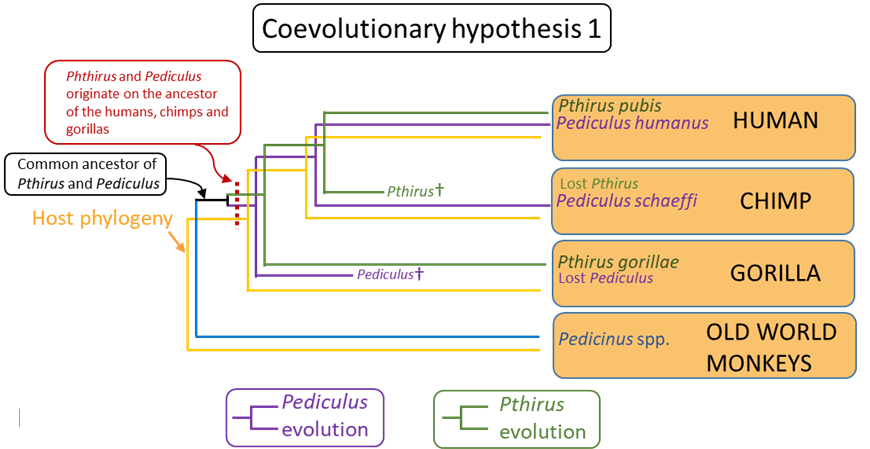
The incongruence between the phylogeny of the hosts and Pthirus (dashed lines, Figure 10) becomes apparent. One explanation for this is that the ancestral Pthirus and the ancestral Pediculus both originated on the common ancestor of the chimps, humans, and gorillas, that is, there was duplication of lineages in that ancestor (see coevolutionary hypothesis 1, Figure 12). Our human hominid ancestors retained both lineages (Pediculus and Pthirus) but the chimpanzee lineage lost Pthirus, while the gorilla lineage lost Pediculus. In other words, in this reconstruction, a neat pattern of cospeciation is altered by extinction events in 2 host lineages (chimps and gorillas) that resulted in the louse-host associations seen today.
Figure 12. Coevolutionary hypothesis 1.
(Source: A. Choudhury, 2019. License: CC BY-NC-SA 4.0.)
There is, however, a simpler explanation that does not require the elaborate extinction events proposed in the previous hypothesis. Instead, it may be proposed that human hominid ancestors acquired the louse ancestor of humans’ Pthirus pubis from some ancient ape of the gorilla lineage, that is, by host-shifting, also known as host-switching (see coevolutionary hypothesis 2, Figure 13) or ecological fitting (see Janzen, 1985).
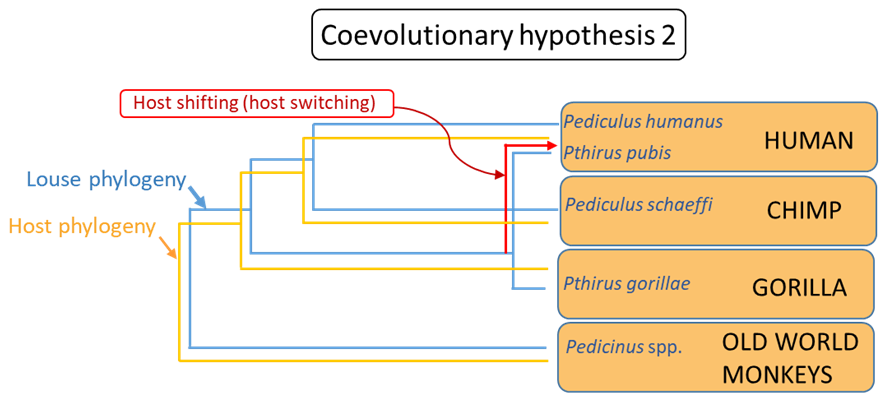
Figure 13. Coevolutionary hypothesis 2.
(Source: A. Choudhury, 2019. License: CC BY-NC-SA 4.0.)
How to choose between these 2 alternate reconstructions or hypotheses? The principle of parsimony may be applied and then it may be argued that the second hypothesis requires only 1 step, 1 instance of host-shifting, to explain the incongruence between the louse and primate phylogenies. In contrast, the first hypothesis required a lineage duplication, followed by 2 separate, independent, instances of lineage extinction. Therefore, hypothesis 2 is the more parsimonious explanation and in the absence of the any other evidence to the contrary, is the preferred working hypothesis. In this particular case, however, the authors were able to apply evidence from estimated divergence times of the primate host lineages to show that neither hypothesis on its own was consistent with the known evolutionary history of the hosts. Their final analysis indicated that both duplication and extinction, followed by host-shifting likely occurred to produce the present-day associations between the lice and their primate hosts.
Phylogenetic Systematics, Coevolution, and Biogeography
Phylogenetic systematics not only allows the examination and exploration of the coevolution of parasites and hosts but also their historical biogeography, that is, how and where they came to be associated with their hosts. Here is a simple example that illustrates this application. The trematode genus Bunodera comprises species that are found in fishes belonging to the family Percidae (perches) and Gasterosteidae (sticklebacks). Three of the species occur in sticklebacks. By mapping the hosts and their distribution on the phylogeny of these trematodes (Figure 14), both the coevolutionary history as well as the history of the host-parasite associations may be deduced. Doing so reveals that the genus likely originated in percid fishes in the northern latitudes and became associated with sticklebacks in North America via ecological fitting in the distant past. There appears to have been further speciation in the freshwater brook stickleback, Culaea inconstans, a stickleback species endemic to the freshwaters of North America.
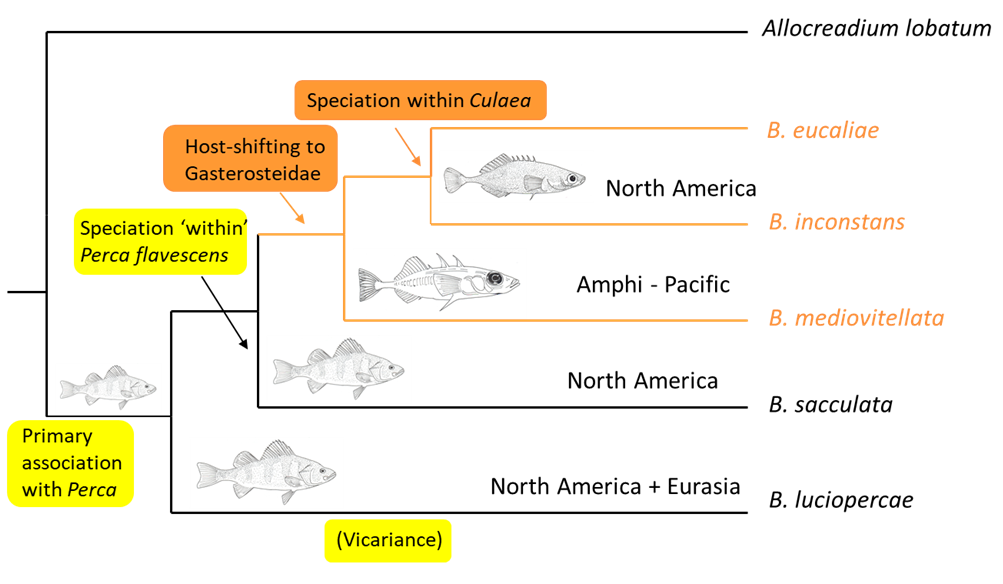
Figure 14. The trematode genus Bunodera likely originated in percid fishes in the northern latitudes and became associated with sticklebacks in North America via ecological fitting in the distant past. There appears to have been further speciation in the freshwater brook stickleback, Culaea inconstans, a stickleback species endemic to the freshwaters of North America.
(Source: A. Choudhury and V. León-Règagnon, 2005. License: CC BY-NC-SA 4.0.)
Phylogenetic Systematics and Mapping Traits
Phylogenetic trees also can help elucidate the evolution of body plans and a variety of morphological, biological, and behavioral traits. Consider, for example, the bewildering diversity of tapeworms, the Cestoda. The vast majority of tapeworms belong to a subgroup called the Eucestoda. Among the eucestodes are an order of unsegmented tapeworms with a single set of reproductive organs, Caryophyllidea. Another order, Spathebothridea, also comprises unsegmented tapeworms, but they possess serially-repeating sets of reproductive structures. The vast majority of the remaining eucestodes have a strobila with externally-visible segments called proglottids. Is the unsegmented condition with a single set of reproductive structures as seen in Caryophyllidea a primitive feature? Are the caryophyllideans an early branching lineage of tapeworms or is their morphology highly modified from strobilate segmented cestodes? Mapping the morphology of tapeworms on their phylogenetic tree allows us to address these questions.
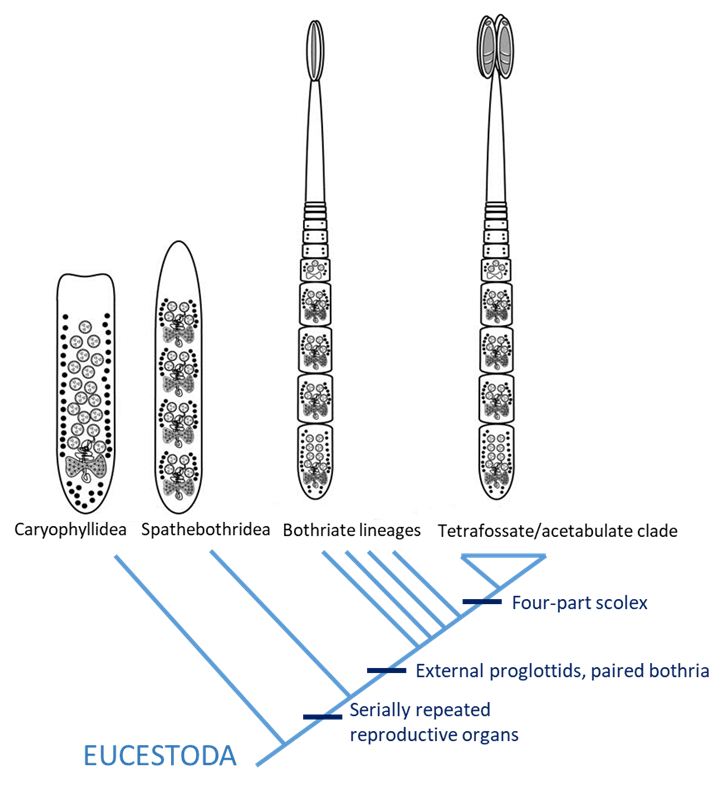
Figure 15. A phylogenetic representation of the evolution of strobilization as a derived character in some cestodes.
(Image source: A. Choudhury modified after Olson et al. (2001), 2019. License: CC BY-NC-SA 4.0.)
A phylogenetic analysis of the Eucestoda by Olson and his colleagues (Olson et al., 2001; see Figure 15) shows that Caryophyllidea is an early-branching group and further reveals that the condition seen in Caryophyllidea is primitive and not highly modified and reduced from strobilate ancestors. The phylogenetic tree also reveals that the superficial external segmentation (proglottisation) of cestodes is a more derived condition and that a scolex with 4 attachment structures (plural bothridia, singular bothridium) may have evolved from a scolex with 2 attachment structures (plural bothria, singular bothrium).
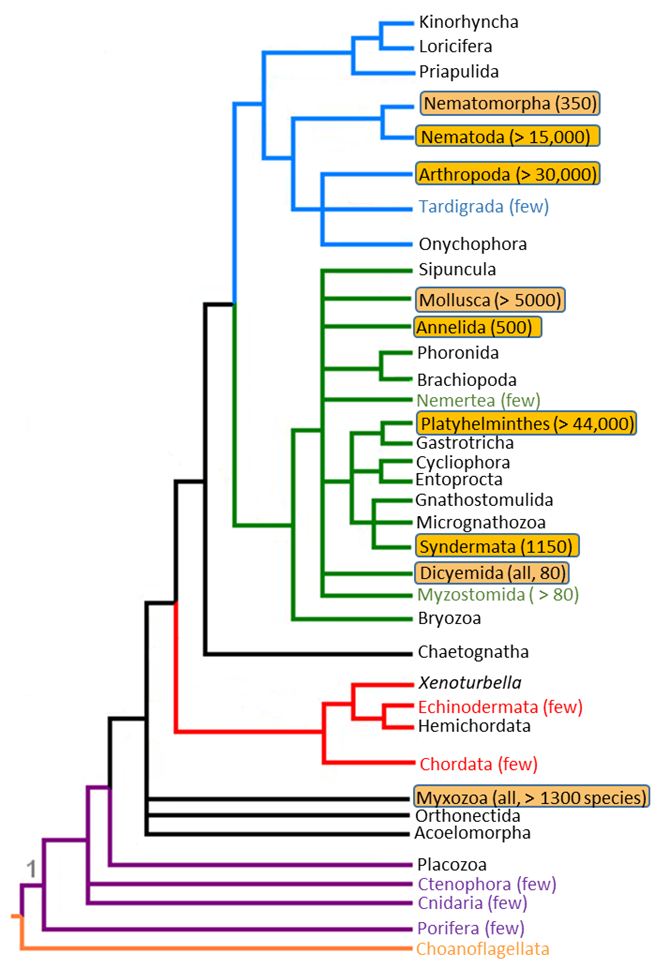
Figure 16. Metazoan phylogeny showing the wide-ranging polyphyly of parasites.
(Source: A. Choudhury modified after Wlodzimierz (2006), 2019. Public domain.)
Parasites Are a Polyphyletic Assemblage with a Common Lifestyle
Parasitology is unique in the field of organismal biology since most other subjects in organismal biology are developed and organized around monophyletic organismal groups; ornithology is the study of birds, entomology the study of insects, acarology the study of mites and ticks, mammalogy the study of mammals, and so on. Unlike these other subjects that deal with monophyletic groups of organisms, parasitology is the study of certain organisms, in this case, parasites—all of which share a common lifestyle (parasitism), rather than a unique common ancestry as a group. In other words, there is no unique common ancestor only for all parasites. If the phylogenetic tree of animals is examined, parasitic species will be found in a wide range of phyla, highlighted in the tree above (Figure 16), along with their free-living relatives. Parasitic nematodes are related to free-living nematodes, parasitic trematodes to free-living trematodes, parasitic annelids to free-living annelids, and so on. The approximate number of parasitic species in each phylum is in parentheses. This clearly shows that parasitism evolved independently many times in the evolution of life on Earth, and that parasites evolved from pre-existing, closely related, free-living ancestors.
Literature Cited
Brooks, D. R. 1985. Phylogenetics and the future of helminth systematics. Journal of Parasitology 71: 719–727. doi: 10.2307/3281702
Choudhury, A., and V. León-Règagnon. 2005. Molecular phylogenetics and biogeography of Bunodera spp. (Trematoda: Allocreadiidae), parasites of percid and gasterosteid fishes. Canadian Journal of Zoology 83: 1,540– 1,546. doi: 10.1139/z05-153
Escalante, A. A, D. E. Freeland, W. E. Collins, and A. A. Lal. 1998. The evolution of primate malaria parasites based on the gene encoding cytochrome b from the linear mitochondrial genome. Proceedings of the National Academy of Sciences of the United States of America 95: 8,124–8,129. doi: 10.1073/pnas.95.14.8124
Galen, S. C. J., E. S. Borner, J. Martinsen, C. C. Schaer, et al. 2018. The polyphyly of Plasmodium: Comprehensive phylogenetic analyses of the malaria parasites (Order Haemosporida) reveal widespread taxonomic conflict. Royal Society Open Science. doi: 10.1098/rsos.171780
Hennig, W. 1966. Phylogenetic Systematics. [Translated by D. Davis and R. Zangerl.] University of Illinois Press, Urbana, Illinois, United States.
Janzen, D. H. 1985. On ecological fitting. Oikos 45: 308–310. doi: 10.2307/3565565
Laumer, C. E., A. Hejnol, and G. Giribet. 2015. Nuclear genomic signals of the ‘microturbellarian’ roots of platyhelminth evolutionary innovation. eLife 4: e05503. doi: 10.7554/ eLife.05503
Olson, P., D. T. J. Littlewood, R. A. Bray, and J. Mariaux. 2001. Interrelationships and evolution of the tapeworms (Platyhelminthes: Cestoda). Molecular Phylogenetics and Evolution 19: 443–467. doi: 10.1006/mpev.2001.0930
Reed, D. L., J. E. Light, J. M. Allen, and J. J. Kirchman. 2007. Pair of lice lost or parasites regained: The evolutionary history of anthropoid primate lice. BMC Biology 5: 7. doi: 10.1186/1741-7007-5-7
Reed, D. L., V. S. Smith, S. L. Hammond, A. R. Rogers, et al. 2004. Genetic analysis of lice supports direct contact between modern and archaic humans. PLoS Biology 2: 1,972–1,983. doi: 10.1371/journal.pbio.0020340
Rutledge, G. G., U. Böhme, M. Sanders, A. J. Reid, et al. 2017. Plasmodium malariae and P. ovale genomes provide insights into malaria parasite evolution. Nature Letters 542: 101–104. doi: 10.1038/nature21038
Weiss, R. A. 2009. Apes, lice, and prehistory. Journal of Biology 8: 20. doi: 10.1186/jbiol114
Supplemental Reading
Sokal, R. R., and P. H. A. Sneath. 1963. Principles of Numerical Taxonomy. Freeman, San Francisco, California, United States.

