
10 Lab 10: Personal Water Use
Introduction
As noted in lecture, Lab #9, and your textbook, water is a critical resource in human society. It is necessary for human-life itself, but also is used for sanitation, agricultural, and industrial purposes. In many U.S. locations, water availability is minimally considered, except in times of intense drought. However, even in seemingly moisture rich regions, the actual availability of fresh, potable water is constantly considered and managed. The reduction of water overconsumption and waste is generally considered a positive thing by resource managers and environmentalists. But for many individuals, conservation seems unnecessary.
A global or even national-level conservation effort seems daunting to a single individual, but such efforts always comes down to small-scale, individual decisions to conserve, or not. To help showcase this, we will use this lab as an opportunity to self-observe our own water use habits and identify ways in which we could conserve water, if we deem it appropriate.
The objectives for this lab are:
- Provide an individualized context for water resource use and availability
- Develop data collection techniques
- Analyze and summarize national-level water consumption data
Background Information/Further Reading
How we use water in the U.S.
In addition to observing your own water usage, you will be investigating water usage across the United States. While you may use different sources of information if you wish, a good place to start is the EPA’s water sense https://www.epa.gov/watersense/how-we-use-water.
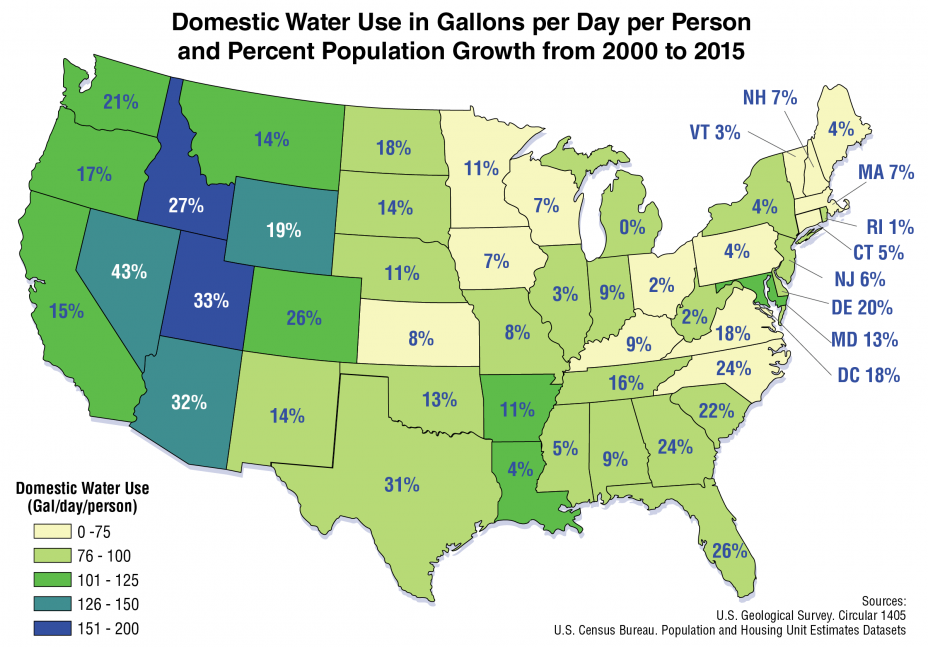
Across the United States, the average American family consumes over 300 gallons of water per day for residential use – This is approximately 80-90 gallons per person per day. Examining the figure on the following page, we can see the domestic water use, in gallons per person per day, for each state as represented by the colors shown on the map. Also shown on this map are percent population growth from 2000 to 2015, as indicated by a number on the state.
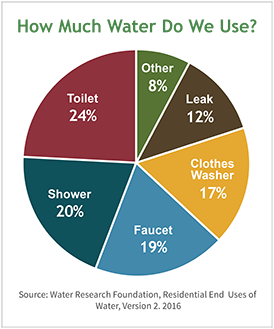
We can also examine the consumption of water how we use. Nationally, approximately 30% of household use of water is for the irrigation of lawns and landscaping. The remaining 70% is broken down above, which shows the 6 most water consuming activities within the average American household.
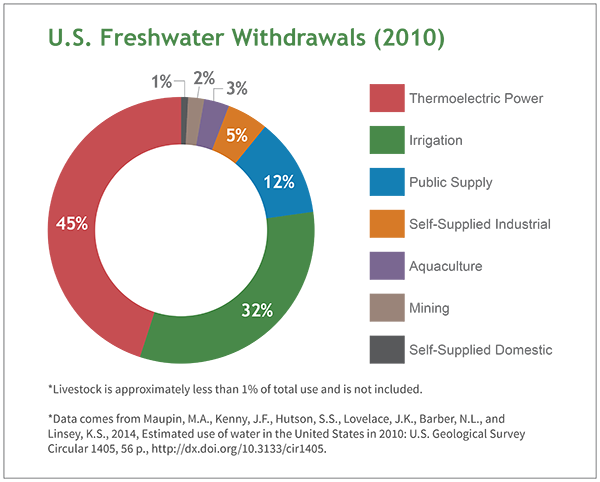
Above, we incorporate all water use, not just at the household level.
Observing Personal Water Use
The primary activity in the lab is to track and record your personal water use. While you may or may not have direct access to your water meter, and/or may share it with others, you can still come up with approximate observations. An excel sheet has been provided to assist in the documentation of your water use. Please use this template.
Questions
Part 1 – National Water Usage
1. Here in the greater Omaha area, what source(s) do most of our water come from? Hint: https://www.mudomaha.com/our-company/our-services/water
2. Excluding irrigation, list the 4 largest sources of residential water use in a typical U.S. home.
3. Now incorporating all uses, based on the “U.S. Freshwater Withdrawals (2010)” graphic, what are the 3 largest sources of water use and their respective percentage of the total?
4. What sorts of negative consequences would a lack of water (or too much demand for water) have on society?
5. Examine the map of the US water use by state, where the color indicates typical Domestic Water Use in gallons per day per person. Approximately how much water does a typical Nebraskan use per day? How does it compare to the rest of the country?
6. What part of the country uses the most amount of water? Explain why this does or does not make sense.
7. Super-imposed on this map is percent population growth from 2000 to 2015. Is there any association between states’ growth and daily water consumption? What is it? What might such an association mean, physically, into the future?
Part 2 – Personal Water Use
8. Create a ‘Water Diary’ for 48 hours. Using a provided excel template, measure and record the amount of water that you use from various sources (shower, toilet, sink, dishwasher, hose, etc.). Record the amount of water used, in gallons, along with the activity and the approximate time/day. Submit this observation ‘diary’ with the lab.
9. How much water did you use during each day of your 48-hour period?
Day 1 _________Day 2____________
10. What activity/source consumed the most amount of water during the 48-hour observation period?
11. Consider the pie-chart of water usage by source you examined for question #2. How do the percentages noted for the average American compare to your percentages?
12. Looking back at your water practices, how would you characterize your consumption/conservation habits in terms of maximizing the use of every drop of water?
13. What things do you think you could do differently to get the most of each gallon of water available to you?
14. On the provided Excel template, typical water-use values of “conventional” and “high efficiency” use are provided. Given your total water use numbers, calculate the difference in water used if you were to upgrade to only high efficiency use. What percentage reduction would ensue?
Part 3 – National-Scale Water Resources
15. Imagine you were appointed as the U.S. Secretary of Water Resources (if it existed), and tasked with appropriately managing water use at a national level. Considering your answers to parts 1 and 2, what are the three most important priority areas you would focus on? What sort of evidence would you need to justify such a decision?
