
2 Lab 2: Observing Weather and Climate
Introduction
The weather of a particular region is considered the state of the atmosphere at a specific time. We typically use descriptors such a temperature, humidity, winds, cloud cover, or pressure to describe the day’s weather. The timing of weather, however, is relatively short, normally spanning hours to days. When we start examining the weather over time, a new term is needed: the climate. Climate is often defined as a statistical summary of the weather at a given location, over an extended period of time, often spanning multiple decades. Rather than describing the atmosphere for a specific day, the climate speaks to average, or more generalized, conditions, while also encompassing features such as variability and trends in the frequency or intensity of specific weather phenomena.
Few physical processes effect our lives on a daily basis more than weather and climate. In gaining a more robust perspective on how the weather/climate varies over time, this exercise utilizes a suite of instruments that allow us to directly measure key characteristics of the atmosphere that contribute to weather and climate. The objectives for this activity are to:
- Measure key meteorological variables (temperature, humidity, cloud cover, and wind speed)
- Explain why the observation values differ between different land cover types
- Assess how the observations compare to the climatology
Background Information/Further Reading
Measuring Temperature
To measure surface temperature, we will be using low-grade Infrared Digital Temperature guns. It works by pointing the instrument’s guiding laser at the location to be observed, pulling the trigger, and recording the temperature. You do not need to put the instrument in contact with the object. Do not point the instrument at someone’s face/eyes, as the laser can cause eye damage. Additionally, do not point the instrument directly into the sun, as this will effectively destroy the instrument.
Measuring Humidity
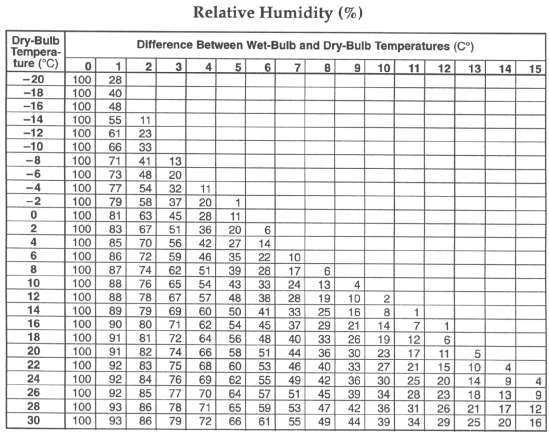
Atmospheric relative humidity will be measured using sling psychrometers. The procedure is relatively simple:
- Wet the cloth that is attached to one of the two glass thermometers with the water provided, being careful to not wet the other thermometer. The thermometer with the wetted cloth is the ‘wet bulb thermometer’ while the one without the cloth is the ‘dry bulb thermometer’.
- Whirl the two thermometers about the handle in the air for about 60 seconds.
- Immediately after the whirling, read and record the temperatures. Their difference is the wet-bulb depression.
- Use the provided table as necessary to determine relative humidity.
Measuring Wind Speed
Wind speed will be measured using handheld anemometers. Hold the instrument up such that the axis of the fan points into the wind. Record the wind speed.
Measuring Cloud Cover
To measure cloud cover, the observer assesses the amount of the sky that is covered by clouds. The unit of measure is the okta, a scale from 0 to 8, where 0 represents a completely cloud-free sky, 4 is a half-cloudy sky, and an 8 is a completely cloudy, or overcast, sky. Often, manual observations use a mirror to determine the measurement, today, we will just be estimating. While this approach is very simple, it does not necessarily account for cloud type or thickness.
0 = Clear, 1-2 = Few Clouds, 3-4 = Scattered,
5-7 = Broken, 8 = Overcast, 9 = Obscured

Policy on Broken Instruments: if a student’s negligence or purposeful action results in a broken instrument, they will be held liable for the costs of replacing it.
Questions
Part 1 – Observation
1. Quickly describe your measurement sites. Be sure in to include information such as the land cover, positioning of any obstructions such as buildings or trees, and the nature of said obstruction (leaves on tree, overhanging roof, etc.).
2. Complete the following table using the instruments made available in lab.
|
Location |
Surface Temperature |
2m Wet Bulb |
2m Dry Bulb |
W.B. Depression |
Rel. Humidity |
Cloud Cover |
2m Wind Speed |
|
|
|
|
|
|
|
|
|
|
|
|
|
|
|
|
|
|
|
|
|
|
|
|
|
|
Part 2 – Analysis.
3. Which site had the warmest conditions? (consider both surface and 2m)
4. How did temperature change with height (surface to 2m) between the sites?
5. Which site had the highest relative humidity?
6. Why do you think that particular site (see question above) had the highest relative humidity?
7. What does a larger wet bulb depression mean for relative humidity?
8. Did cloud cover vary between the sites? If so, what could be the cause of that?
9. Which site had the windiest conditions?
10. What sorts of errors or limitations may have biased your observations and/or analysis? Be sure to indicate how the listed features may have caused errors. Consider any nearby obstructions, the instruments, the observer, the time of day, anything that could have biased your observations.
Part 3 – Climatology.
The following graphics depict average monthly conditions at Eppley Airfield, at approximately 10 am local time, over the last 30 years. Each variable is clearly labeled.
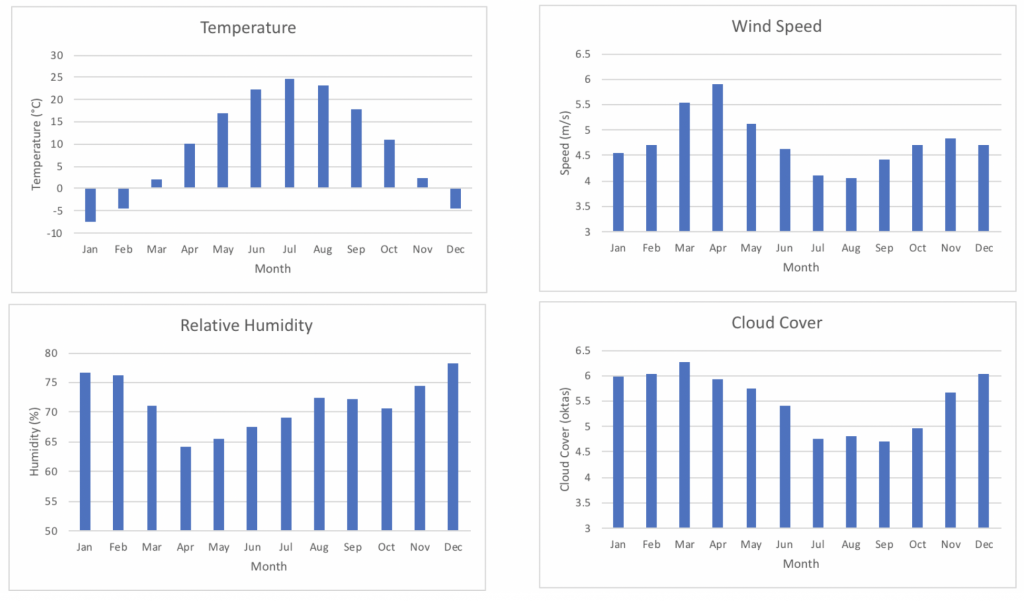
11. In bullet or paragraph form, describe how your observations taken today compare to the climatologies of temperature, relative humidity, cloud cover, and wind speed for the Omaha area. Be sure to note any practically significant differences and if present, a discussion of why you think those differences from climatology occurred.
