
7 Lab 7: Solar Energy
Introduction
The primary energy source for the Earth’s climate system is solar radiation (i.e. shortwave, or visible light from the Sun). The amount of that radiation reaching the surface of the earth changes on a daily and seasonal basis due to the positioning of the earth relative to the sun, and climatic features such as cloud cover and atmospheric concentration. In determining the potential for solar energy to be used, practically, as a form of alternative energy, it is critical to know just how much solar radiation reaches the surface. Once measured, the amount of electricity the solar panel provides can be calculated, and an informed decision on if and/or where installing the panels can be made.
In today’s lab, we will be measuring the incoming solar radiation at multiple locations on campus, then using those observations to determine a rough ‘feasibility’ figure, given average costs and efficiencies. The objectives of this lab are to:
- Confidently measure solar radiation and interpret the observations
- Calculate the electricity yield for a standard solar panel given those observations and within climatology
- Run a cost-benefit analysis of installing a solar panel suite on campus
Background Information/Further Reading
Earth-Sun Relationships
The four most important factors that determine the amount of incoming solar radiation reaches and is absorbed by the surface are: (1) the time of day (i.e. solar altitude), (2) the day of the year (i.e. solar declination; length of day light), (3) the percentage (and type) of cloud cover, and (4) surface albedo.
- Over the course of the day, the sun’s angle above the horizon (solar altitude) changes as a function of Earth’s rotation on its axis. This influences the intensity of solar radiation, where the surface receives more energy from the sun at noon, compared to when the sun is rising or setting. Thus, energy from the sun is considered ‘most intense’ at noon. The maximum altitude of the sun depends on the time of year and latitude
- The intensity of solar radiation varies substantially over the course of a year based on the Earth’s tilt and revolution around the sun. In Nebraska (approximately 41°N latitude), average daily radiation at the top of the atmosphere varies from 150 Watts per meter squared (W/m2) in the winter, to 450 W/m2 in the summer.
- Clouds, particularly liquid-based clouds, reflect a portion of incoming radiation back to space, thus less radiation reaches the surface. Liquid-based clouds are more effective at reflecting solar radiation than ice-based clouds.
- Based on the reflectivity, or albedo, of the surface, a percentage of incoming solar radiation is reflected away and a percentage is absorbed. Lighter surfaces have a higher albedo, thus reflect more incoming solar radiation and absorb less (typically making them cooler).. Darker surfaces on the other hand have a lower albedo, thus reflect less, and absorb more (typically making them warmer).
Solar Panels
At its most basic, solar panels are a series of photovoltaic cells linked together that harnessing photons (particles of light) to generate electricity. As the photon hits the cells, electrons are excited and ‘freed’, then transported away via an established electric field within the cell, yielding electricity. These are the most commonly-used house-hold and commercial versions of solar power technology, but other forms, such as solar thermal and concentrated solar panels, also exist. There are a number of extending readings on these types of solar panels available online.
Today’s solar panels are substantially more affordable then their previous versions from only a decade ago, however there are still upfront costs associated with installing these panels, and due to energy availability and efficiency concerns, they may or may not be a viable option for every location. Every solar panel has a maximum wattage rating, which indicates how much energy can be harnessed at ideal conditions. Naturally, conditions are not always ideal, and during these non-idealized times, the efficiency of the panel decreases. Warmer temperatures, older panels, and shaded conditions can all result in lower electricity yield.
Calculating Electricity Generation
For our purposes in this class, the amount of energy a solar panel generates at any given time can be estimated using the following equation: E = A * H * r, where E is the energy yielded (kW), A is the panel surface area (m2), H is the solar radiation hitting the panels (kW/m2), and r is the efficiency rate. To determine the total amount of energy a solar panel generates during a given day, we would need to integrate all energy observations over the course of a given day (aka calculate this equation for every instant for the entire day and add them up). What we will do here in class is use rounded hourly bins for convenience. Further instructions are included in the ‘questions’ section.
In the energy business, electricity is typically reported in kilowatt-hour (kWh). This is a measure of the amount of energy needed to power a 1,000-watt appliance for 1 hour. For instance, a 100-watt light bulb would use 1 kWh of energy in 10 hours. So for our solar panels, we’ll need to convert our watts (W) to kWh. 1 kW = 1,000 W. 1 kWh is the production of 1kW continuously for a period of 1 hour. Here in Nebraska, we pay, on average, about 9.0 cents per kWh (which is one of the lowest rates in the country!).
Measuring solar radiation
To measure solar radiation, we will be using pyranometers. This instrument records the amount of solar radiation that enters the fixture, and shows the W/m2 value in the display. These can be pointed in any direction. While they are relatively sturdy, they can break by dropping them, so please handle with care. Once you are done taking observations, please turn the sensor off!
Questions
Part 1 – Observing Solar Radiation
1. In your assigned teams, choose two locations in the surrounding area outside of lab, one should be in the shade (i.e. under a tree/awning or next to a building) while the other should be not obstructed (i.e. open area). Complete the table below.
|
Location 1:
|
Location 2: |
|
Site Description:
|
Site Description:
|
|
Sky Cover Observation (see previous labs):
|
Sky Cover Observation: |
|
Time of Observation(s): |
Time of Observation(s):
|
2. Take multiple observations (at least 3) of solar radiation at each site and record below. If the sun is visible (don’t look right at the sun!), take note of this, and point the pyranometer directly at the sun. If not, point it straight upwards. Take the average of the 3 observations for each site.
|
Obs. #1: |
Obs. #1: |
|
Obs. #2: |
Obs. #2: |
|
Obs. #3: |
Obs. #3: |
|
Average: |
Average: |
Part 2 – Electrical Energy Generated
3. Assuming the following, calculate the amount of energy (in kW) a solar panel would have harnessed at the time you took observations at both sites. Use the averages you calculated in #2 as your H term. Assumptions: solar panel dimensions: 1.0m wide x 2.0m tall; panel efficiency rate: 18.5%
4. Which site generated more electricity? How much more energy did the one location produce than the other?
5. Your observations were only one instant throughout the entire day. What factors can influence the amount of electricity a solar panel can generate (consider both physical and mechanical characteristics over time)?
6. Given the time of observation and your answer to question 5, do you think the observations you took would represent a time of peak solar efficiency? Why or why not?
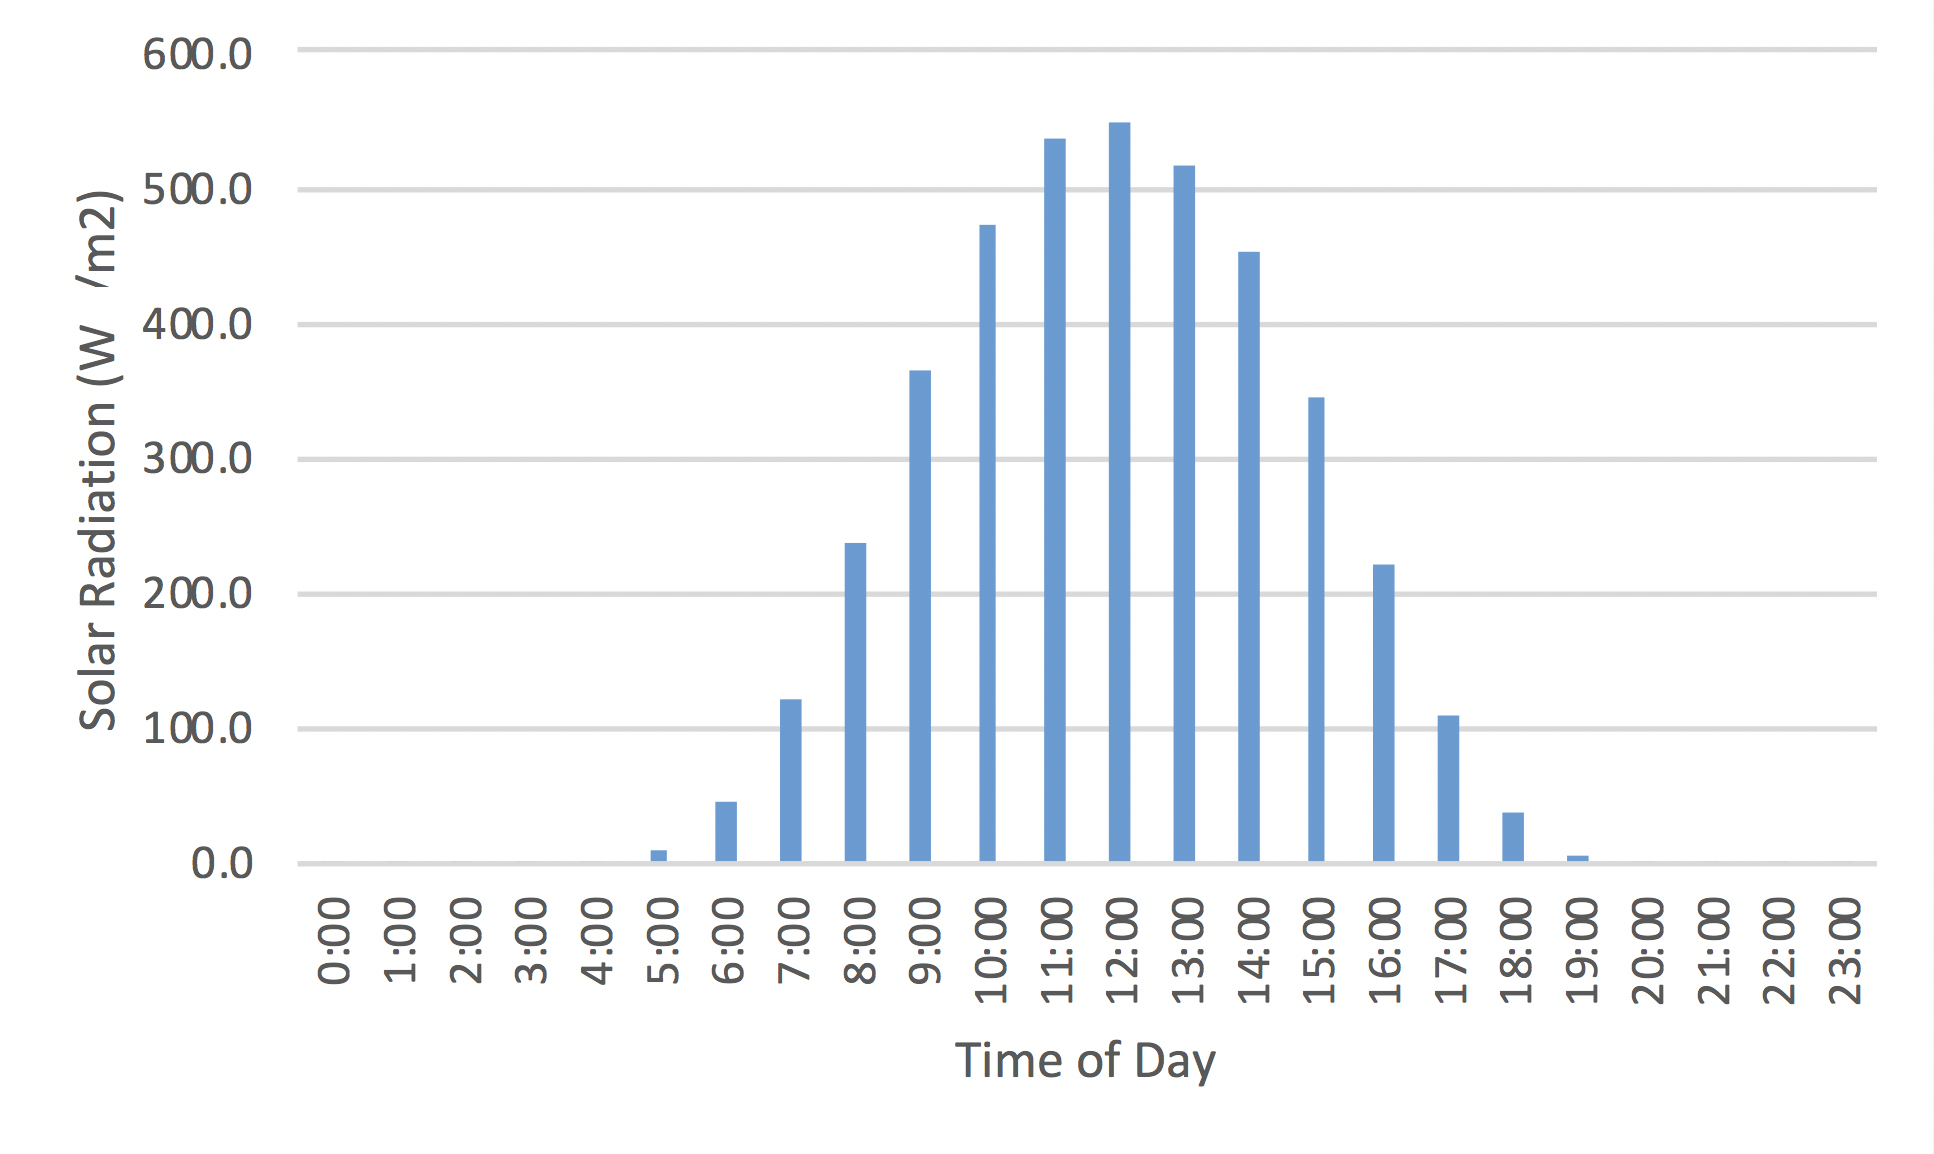
7. Over the course of the day, solar radiation varies. Peak levels occur around noon, with minimal levels overnight. The table and graphic below represents the diurnal cycle of solar radiation (in W/m2) for an average day in Omaha.
What’s the average hourly radiation received of the day in kW/m2? Hint: first sum the hourly values, divide by the number of hours, and then scale to kW.
| Time of Day | Solar Radiation (W/m2) |
| 0000 | 0.0 |
| 0100 | 0.0 |
| 0200 | 0.0 |
| 0300 | 0.0 |
| 0400 | 0.2 |
| 0500 | 9.7 |
| 0600 | 48.3 |
| 0700 | 124.1 |
| 0800 | 2376 |
| 0900 | 365.1 |
| 1000 | 472.3 |
| 1100 | 537.4 |
| 1200 | 546.1 |
| 1300 | 516.9 |
| 1400 | 451.7 |
| 1500 | 345.5 |
| 1600 | 222.1 |
| 1700 | 111.7 |
| 1800 | 39.2 |
| 1900 | 6.3 |
| 2000 | 0.1 |
| 2100 | 0.0 |
| 2200 | 0.0 |
| 2300 | 0.0 |
8. As noted in the background, electricity usage is typically reported in the units kWh. To convert from kW to kWh, you need to account for the total amount of power and the amount of time. This is simply the power (kW) * time (hours). For example, an average hourly total of 0.5 kW for a total of 24 hours would yield a daily energy use of: 0.5kW * 24 h = 12 kWh.
First, calculate how much energy is generated over the entire day from the example in question #7, in kWh, and write it in below. Hint: (hourly average * hours in the day).
Using the answer from directly above, and the same panel area and efficiency rates from question #3, calculate how much energy an average solar panel would generate in Nebraska (in kWh) per day.
Part 3 – Feasibility
9. The average Nebraskan uses approximately 33 kWh per day of electricity. Would our typical solar panel (answer to #8) generate enough electricity to cover this entire demand? If not, what percentage would it cover?
10. What is the minimum number of panels we would need to cover the demand calculated in #9?
11. A typical house roof is about 150 m2 in area, but only about half is usable for panels. Given the this, and the number of panels needed to cover the typical Nebraskan’s energy demand (i.e. #10), is there enough room on the roof? Show your work.
12. Say you’re a homeowner and decided to install 25 solar panels on your roof. Using your calculations from above, how much energy would the panels generate per day? Hint: Use your answer to #8 for daily energy generated (in kWh), but scale up to 25 panels.
13. How much energy would the answer to #12 be for a 365-day year?
14. The cost of electricity is approximately 9.0 cents per kWh here in Nebraska. For a 365-day year, how much money would the electricity your solar panels generate?
15. The cost of your 25-panel solar setup was $12,000. Assuming there are no other maintenance costs or changes to electricity pricing, how long would it take for you to make your money back on your initial investment?
16. Let’s say you lived in Burlington, VT where electricity is approximately 16 center per kWh. Hypothetically, Burlington receives the same amount of solar energy as Omaha, and you built the same solar array there as you did in Omaha. Recalculate questions 14 and 15 for Burlington, determining (a) the price of the electricity generated using Burlington prices, and (b) how long it would take you to make your money back in Burlington.
17. This lab represents a very idealized scenario. What other factors (physical, mechanical, political, economic, etc.) come into play in reality when factoring in the feasibility of installing a solar panel system?
18. The data shown in question 7 is the average across many years. Within a true calendar year, how might solar radiation actual change? How could a changing climate influence these solar radiation observations?
