
9 Lab 9: Water Budgets and Balances
Introduction
A water budget reflects the relationship between water inputs and outputs for a region. At its most simple, this can be examined by tracking the supply vs. demand for water. During times of more supply than demand, there is a surplus. While for the opposite, when demand exceeds supply, there is deficit. At any given point, there are many different places in the world experiencing water surplus and many others experiencing water deficit. This availability of water is critical for ecological purposes, but also for humans, in the form of consumption, sanitation, irrigation, and industrial uses. In this lab, we will examine some of the key components of water budgets, quantitatively assess their variations, and discuss the ramifications of surplus and deficits to local communities.
The objectives for this lab are:
- Assess the current water availability (surplus vs deficit) across the United States
- Describe the physical characteristics of drought and their impacts
- Leverage a model to evaluate climatological water budgets for different locations
Background Information/Further Reading
‘Calculating’ a Water Budget
As noted above, a water budget tracks the inputs and outputs of water into a region. While more complicated budgets exist, a simplistic budget of water is the difference between the amount of precipitation (rain, snow, sleet, etc.; i.e. supply) and the potential evapotranspiration (PET; i.e. demand for water). PET represents all of the water that could enter into the atmosphere from the surface via evaporation and transpiration if there was an unlimited supply of water; transpiration is effectively when plants uptake water through its roots, then evaporate the water from small pores in the plant’s leaves. PET is based on the temperature and the amount of solar radiation available.
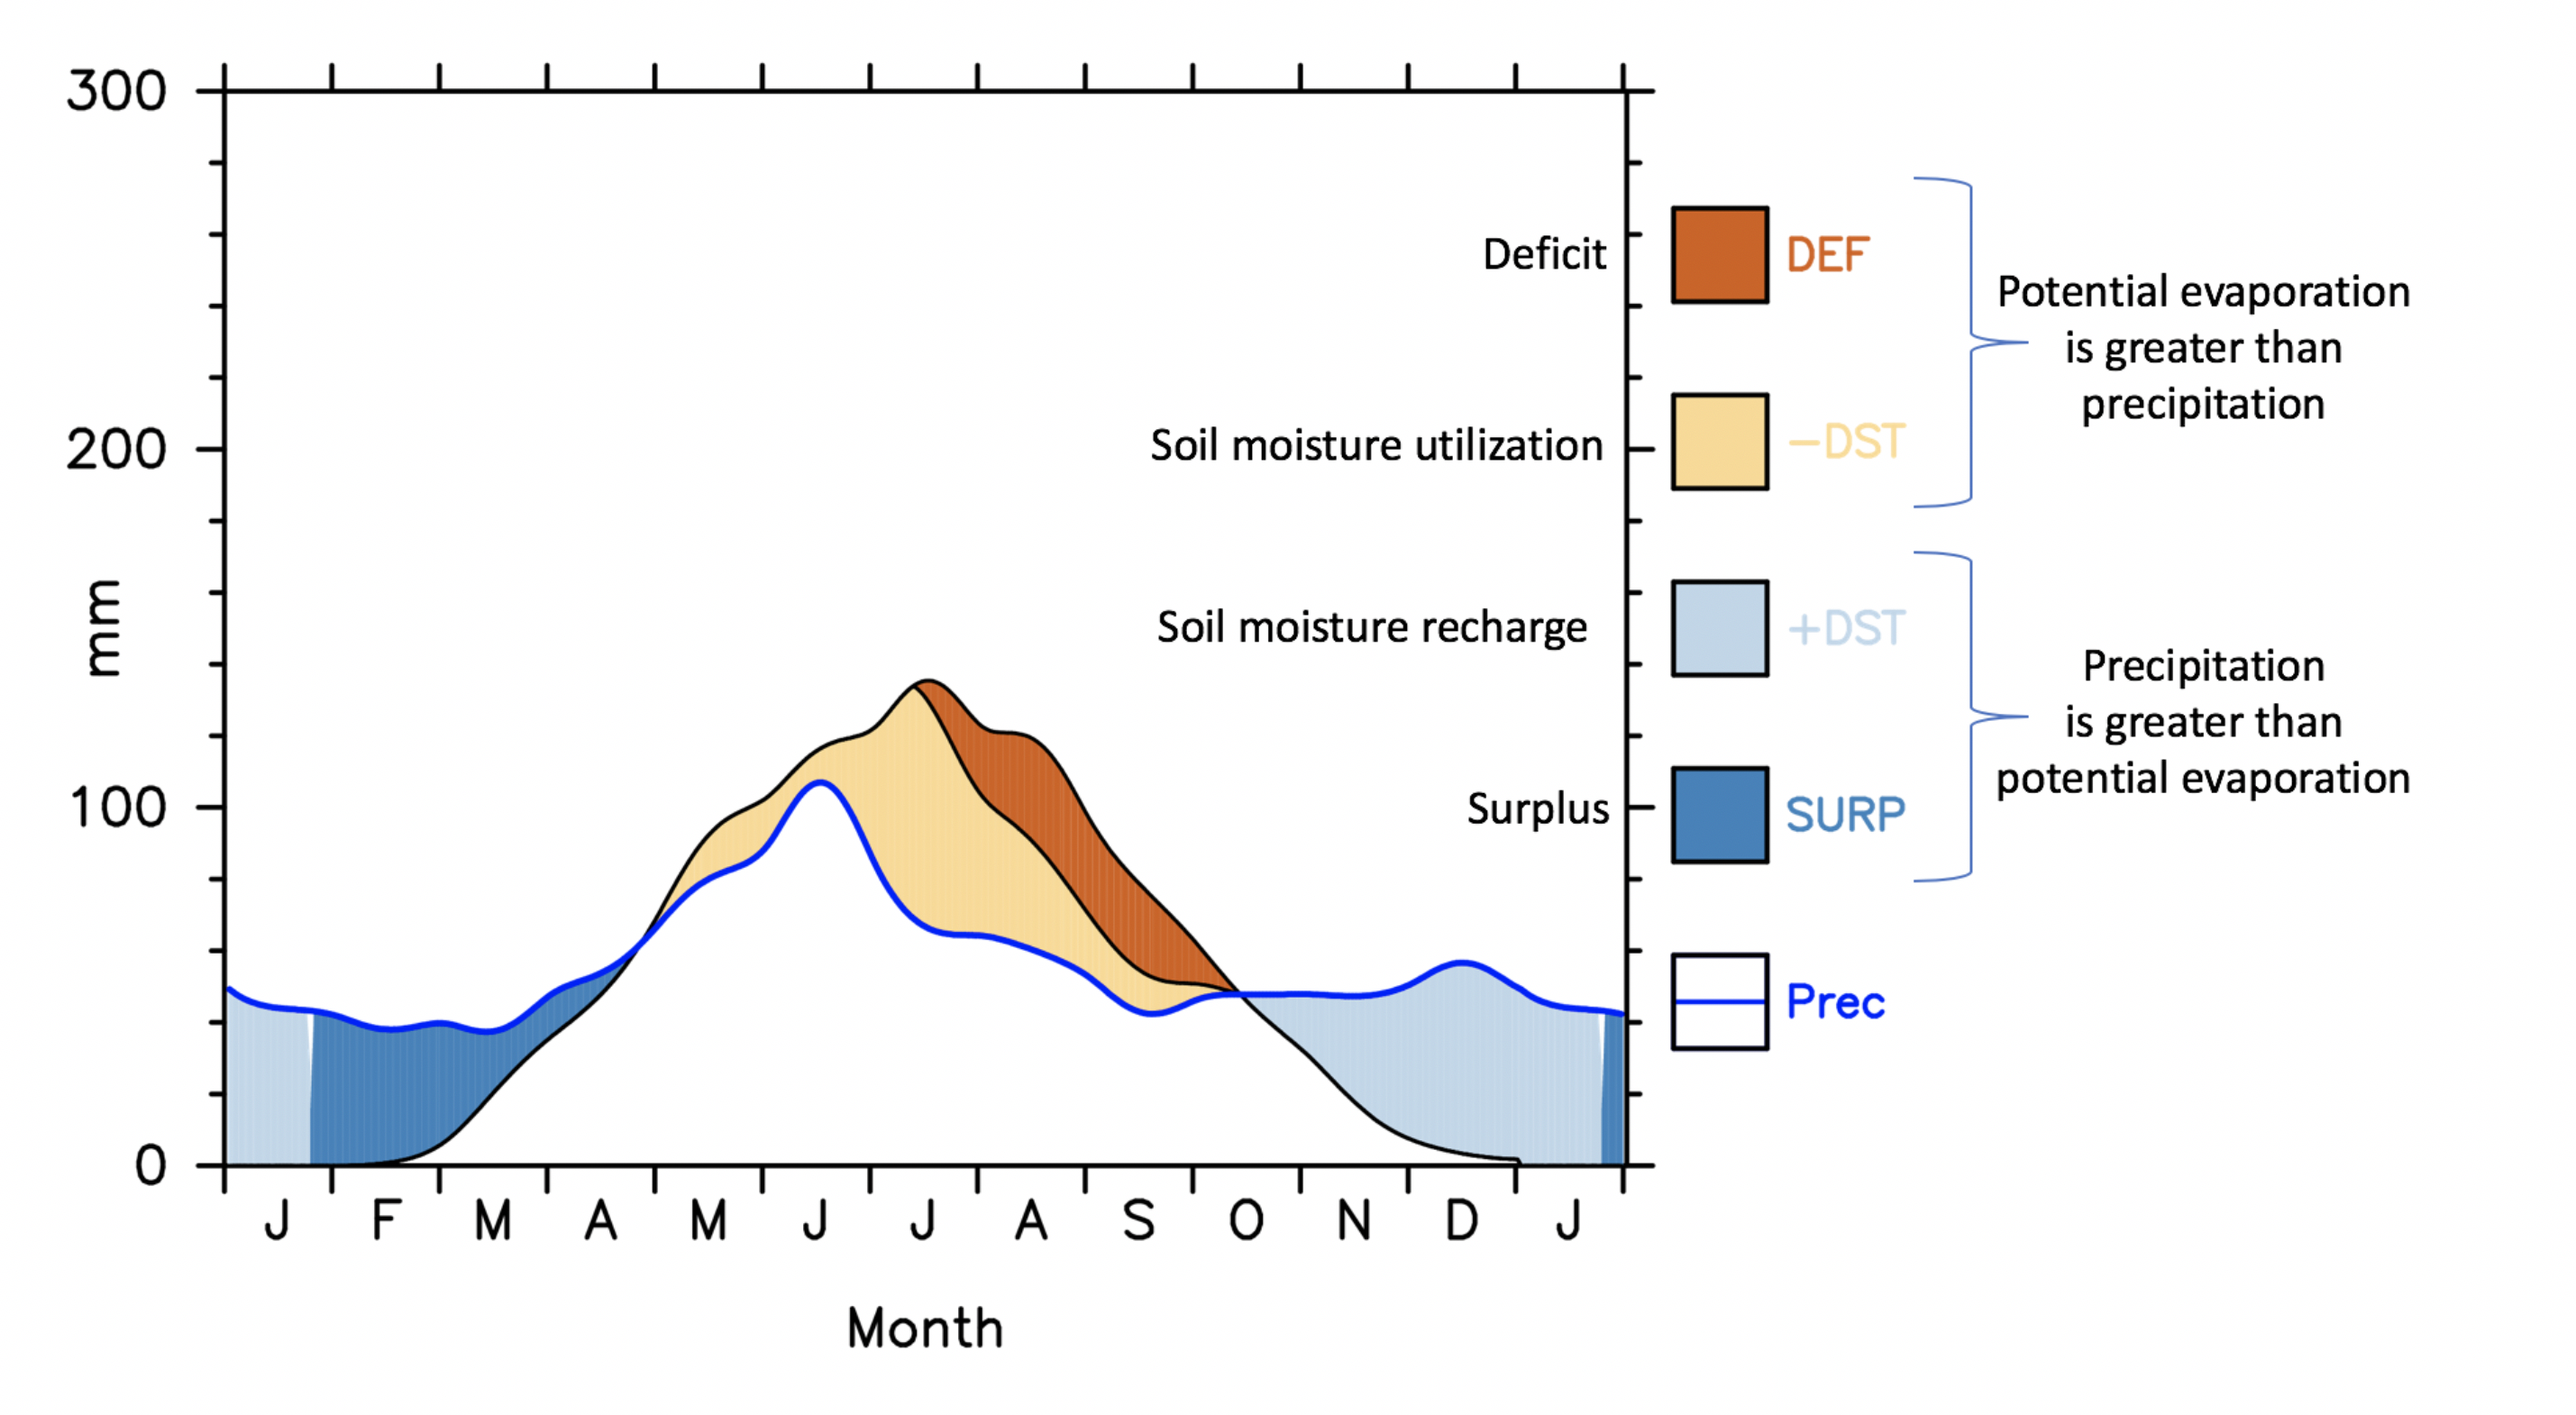
These two variables (precipitation and PET) are often tracked and displayed graphically, in the form of a water budget or water balance graph. For each month, a climatological average amount of precipitation and PET are graphed together. In the graph on the follow page, x-axis represents a calendar year from January to January, where each letter stands for the corresponding month (in order: J = Jan, F = Feb, M = Mar, etc.). The y-axis represents an amount of water (in millimeters). The solid blue line indicates the amount of precipitation during each month, on average. The solid black line indicates the PET.
Where the precipitation (blue line) is higher than the PET (black line), this means there is more supply than demand, and there is a surplus of water. This is noted by blue shading. When PET is higher than precipitation, this indicates deficit, and is noted by the yellow/orange shading. For reference, DEF = deficit; – DST = decreasing soil moisture; + DST = increasing soil moisture; SURP = surplus. DST is the estimated change in soil moisture from the end of the previous month, to the end of the current month (in mm). When negative (-), water is taken from the soil to meet the needs of PET. When positive (+), water is restored back to the soil via precipitation/runoff.
In this example, we can see that the location is in surplus during the late-winter/early-spring, then deficit in late summer. During autumn, soil moisture is recharged.
Using University of Delaware WebWIMP
We will be using an online model to generate water budgets at different locations. This model was developed at the University of Delaware by K. Matsuura, C. Willmott, and D. Legates in 2003 (go Blue Hens!), and has been updated in the past. The original version was developed by C. Willmott, D. Legates, and C. Rowe. Details of how it works are available on the introductory webpage (http://climate.geog.udel.edu/~wimp/).
The first step after reading the intro, is to click the “proceed to the world map” link. This will open a new tab for a low-resolution map. By clicking on the map, or entering coordinates in the longitude/latitude boxes, you can select a specific location to examine. Round your latitudes and longitudes to the nearest half degree (xx.0 or xx.5). Please note, do not click on a location too close to, or in, the ocean, as this will result in an error. Once the location is selected, it will open another tab, which will present a table of temperature and precipitation, along with some options to induce a ‘hypothetical change’. For now, leave these all alone and scroll to the bottom of the page, clicking the link for ‘Calculate the monthly water balance’.
This will generate a few tables. The one of importance for this specific lab is the ‘Monthly and annual climatic water balance table’. It has monthly values for a dozen different variables. Some should be familiar (TEMP, DEF, SURP), but others may be less familiar. You can quickly figure out what they are by clicking the link associated with the variable (example, click “TEMP”, and a box will pop up with a definition). You will be using this data table to answer some questions, but also using the associated graph. You can generate the graph by clicking the “graph” link at the bottom on the page. A new tab will open containing the graph.
Drought
During times of deficit, there isn’t enough water to meet demand. This can indicate a drought. Droughts can have wide-ranging environmental and societal impacts, particularly to more vulnerable communities. Four different types of drought are used operationally: Meteorological Drought, Agricultural Drought, Hydrological Drought, and Socioeconomic Drought. Meteorological drought is based on how dry conditions are compared to normal and are regionally specific. Agricultural drought focuses on precipitation shortages, differences between potential and actual evapotranspiration, soil water deficits, and groundwater levels, all in application to agricultural impacts. Hydrological drought examines drought typically over longer periods of time, incorporating the frequency of intensity of precipitation, streamflow, groundwater, and lake-level shortfalls. Socioeconomic drought expands on these previous types of drought by considering the human demands for water, which often vary on multiple time-scales. Further detail on the types of drought, and drought research can be accessed at the National Drought Mitigation Center (https://drought.unl.edu/) among other locations.
One of the most common metrics for drought and moisture intensity is the Palmer Drought Severity Index (PDSI). PDSI is based on temperature and precipitation observations to estimate the degree of dryness on a unitless scale. In brief, the more positive the number, the more wet conditions are, while the more negative the number, the drier conditions are. Typically, values fall between 4.0 and -4.0, but extreme values outside of that range are possible.
The easiest way to find current PDSI in the U.S. is to use this link: https://www.drought.gov/drought/data-maps-tools/current-conditions. *you’ll have to scroll down the page a little.
There are a number of national-level drought-focused centers across the U.S., including the Climate Prediction Center (https://www.cpc.ncep.noaa.gov/products/Drought/), National Drought Mitigation Center https://drought.unl.edu/Home.aspx), and the National Integrated Drought Information System (NIDIS: https://www.drought.gov/drought/). All of these have a large wealth of information on drought, along with real-time and historical drought data.
Questions
Part 1 – Drought
1. Define what drought is. Be sure to note the 4 different types of drought.
2. Using the provided PDSI data, where are zones of severe to extreme drought? Where are there very or extremely moist conditions?
3. How does our region, eastern Nebraska, look currently in terms of PDSI? Does this make sense from your recollection of the weather in town over the last few months, why or why not?
4. Compare the current PDSI to that of 2019. What was unique about 2019?
5. Compare the current PDSI to that of 2014. What was going on in the US with respect to PDSI during this period?
Part 2 – Water Budgets
For questions 6-11, base your answers on the provided Water Balance for Omaha (latitude: 41.5 longitude: -96.0).
6. In which month(s) does Omaha generally experience a surplus?
7. In which month(s) does it experience a deficit?
8. Using the table, what are the maximum surplus and deficit observed during a typical year, in mm?
9. Are there any times of year where there is a not PET (i.e. the black line is at zero)? If so, In which month(s)?
10. What do you think a zero (or negative) value of PET mean physically? Hint: think about when this occurs and what the weather outside typically is.
11. Note the large spike in February/March. What do you think this is? Feel free to consult the table for help, or think about your experiences with water during that time of year.
Navigate to the WebWIMP portal. Select two other locations across the world to examine a water budget. Both should be outside of the U.S. In the event of technical difficulties, sample locations are available in the supplementary data.
Location #1: Lat _______ Lon _______ Name __________________________
12. In which month(s) does it experience a water surplus?
13. In which month(s) does it experience a water deficit?
14. In which month(s) does the region’s soil moisture recharge?
15.In which month(s) does the regions soil moisture decrease?
16. Is there a clear rainy or dry season? If so, in which month(s) does it occur?
Location #2: Lat _______ Lon _______ Name __________________________
17. In which month(s) does it experience a water surplus?
18. In which month(s) does it experience a water deficit?
19. In which month(s) does the region’s soil moisture recharge?
20. In which month(s) does the regions soil moisture decrease?
21. Is there a clear rainy or dry season? If so, in which month(s) does it occur?
22. Which of your three locations (Omaha, plus the other two) would have the easiest time having large agriculture productivity, independent of irrigation? Why?
23. Which location is most likely to be concerned with droughts and a lack of water availability for human needs? Why?
24. A changing global climate is very likely to result in more variable precipitation conditions world-wide, including an increase in the frequency of drought and the frequency of excessive precipitation, though not necessarily in the same places. For one of your locations, write down some possible impacts such changes could cause, and share some ideas how that community could try and prepare.
Extra Credit Question
25. Consider your initial assessment of the current drought/PDSI conditions across the United States. Using your knowledge of water budgets, hypothesize the cause of the spatial pattern of drought/excessive moisture.
