
4 Lab 4: Environmental Hazards – Air Pollution
Introduction
Air pollution is defined as the emission or release of pollutants into the atmosphere, where the pollutants are visible or invisible particles/gases that are not a part of the normal composition of air. Perhaps the most obvious pollutants are the airborne wastes associated with fuel combustion, which are seen emitted from factories, power plants, and vehicles. Particulate matter is often the most visible source of air pollution, and is arguably the largest source of anthropogenic air pollution. However, there are also natural (non-anthropogenic) sources, such as the particulate matter and gases emitted by volcanoes, the smoke from lightning-causes fires, dust storms, and pollen. Regardless of source, particulate matter can be harmful to plant, animal, and human life and well-being.
The primary objectives for today are to:
- Develop a working definition of particulate matter and comprehend the indices used to track/monitor it
- Assess and compare air quality across the United States, in Omaha, and in other locations worldwide
- Measure air quality in different locations and make comparisons across space
Background
Sources of Air Pollution
There are three categories of anthropogenic air pollution: Point, Area, and Mobile. A point source is perhaps most simply thought of as a feature that is fixed in space that emits a large amount of pollutants, such as a factory smokestack. In contrast, area sources are a combination of multiple, less impactful, sources that when combined, emit a large amount of pollutants. An example of area sources would be a park with multiple campsites, where each site had a campfire. A single campfire itself produces small amounts of pollutants, but the combined impact of 20-30 campfires together create a substantial emission. Mobile sources are ones that move, such as those from sources of transportation (i.e. cars, trucks, trains, plains, etc.).
The Environmental Protection Agency (EPA) defines five Criteria Pollutants, pollutants for which there are established laws and standards for air quality. They are: ozone (ground level), particulate matter, carbon monoxide, sulfur dioxide, and nitrogen dioxide. Definitions of these criteria pollutants is available below, and further information can be found at: https://www.epa.gov/criteria-air-pollutants. With higher concentrations of these pollutants, there are higher health risks including: aggravated cardiovascular and respiratory illness, added stress to the heart and lungs, respiratory system cell damage, fatigue, asthma, irritation of eyes, nose, and throat, and shortness of breath.
Ozone (ground-level): Tri-atomic oxygen (O3) which forms by chemical reaction between nitrogen oxides (NOx) and volatile organic compounds (VOC) when exposed to sunlight. NOx and VOC are byproducts of various combustion reactions.
Particulate Matter (PM): Small particles in the air, such as dust, dirt, soot, or smoke. There are two varieties: PM2.5 and PM10. The number corresponds to the size of the particulates, in micrometers. PM2.5 are about 2.5 micrometers and smaller (about the 30 times larger than the thickness of a human hair. PM10 are 10 micrometers or smaller.
Carbon Monoxide (CO): A odorless and colorless gas released when something is burned, such as natural gas, gasoline, and organic matter.
Sulfur Dioxide (SO2): Compound primarily resulting from fossil-fuel-based combustion at power plants, however vehicles, mining and volcanic eruptions also emit SO2.
Nitrogen Dioxide (NO2): A highly reactive gas which is emitted to the atmosphere due to the burning of fuel such as gasoline and diesel.
Air Quality Index
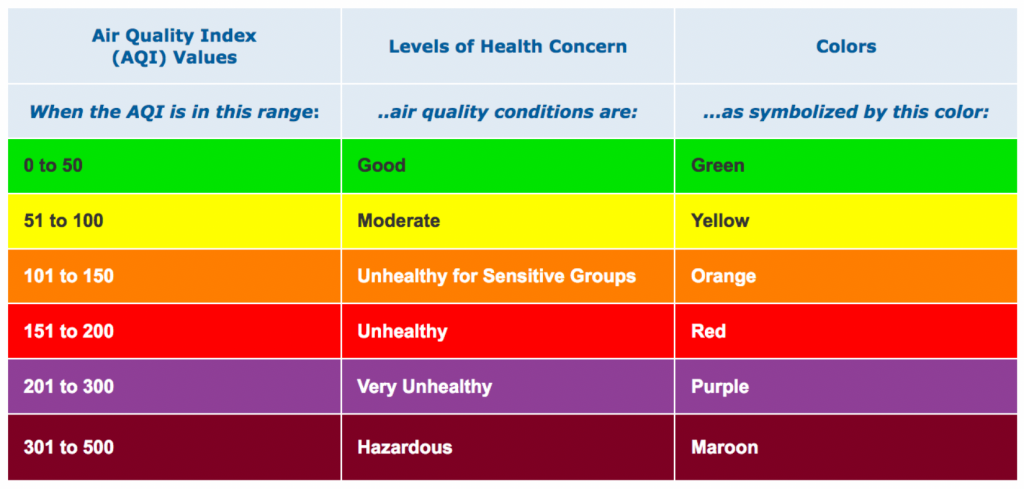
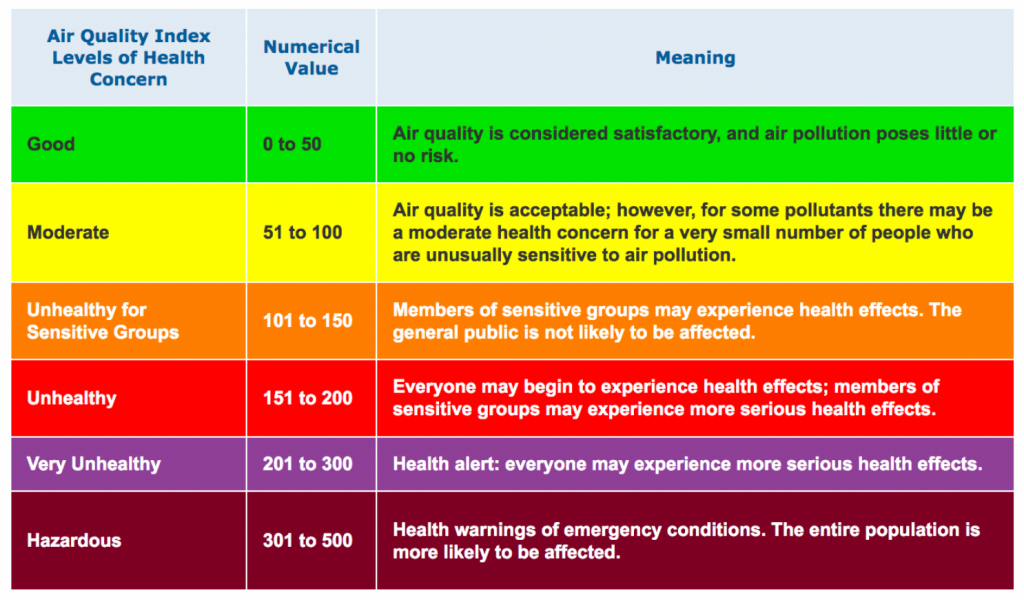
To assist in determining how clean (or polluted) the air is, and inform the associated health risks, the Air Quality Index (AQI) was created. It focuses on the health impacts you may experience after a few hours or days breathing the polluted air, and is based on levels of five (of six; excludes lead) criteria pollutants. The AQI works as a running scale from 0-500, where the lower the number, the cleaner and safer the air, and the higher the number, the more polluted the air. While lower is better, values below 100 are generally considered satisfactory. The following tables outlines the AQI’s values.
Measuring Air Quality
Hand-held instruments will be provided in class. They sample the air directly in contact with the device, and report the value onto the screen. Similar to lab 2, these are “point and click” type instruments. Please treat these with care and do not touch the sensor. Do not breathe into the sensor.
Further Information and Data used in Lab
In reaching the learning goals for today’s lab, we will be utilizing data from a variety of air quality monitoring groups within the US and worldwide. AirNow, a part of the EPA (https://www.airnow.gov/), provides near real-time observations of air quality and allows for comparisons between cities, based on the last 10 years of data (https://www3.epa.gov/aircompare/). Additionally, data are available globally from World Air Quality Index project (https://waqi.info/). We will be providing you case-study data for analysis in lab, however you are welcome to explore these data on your own.
Questions
Part 1 – Real-Time Air Pollution Conditions
You will be provided with (a) AQI map of the United States, (b) AQI map of the Omaha area, (c) table of AQI criteria pollutants for Omaha area, (d) AQI map for the world, and (e) AQI data for two specific locations outside the United States.
1. Using (a), describe the AQI across the U.S. Be sure to note the general areas where AQI is not Good (i.e. where is it Moderate, USG, Unhealthy, Very Unhealthy, and/or Hazardous).
2. Where is the location with the highest AQI? What’s the AQI, approximately?
3. What sort of health impacts could be expected at an ‘unhealthy’ or high category?
4. Using (b) and (c), answer the following:
The current AQI in Omaha is _________________.
The current Ozone AQI is __________________.
The current PM10 AQI is ___________________.
The current PM2.5 AQI is ___________________.
5. Examining the forecast for today and tomorrow (using (c)), do we need to be concerned about air quality? Why or why not?
6. Keeping these values in mind, let’s put them into context of values across the world. Using (d), where is AQI data generally available, based on the map? Where is it not available?
7. Hypothesize why AQI data is available (or not available) where it is (or isn’t).
8. Two locations, not in the United States, are provided to examine in further detail (e). Use them to answer the following questions. If you’d prefer to choose your own locations, please confirm this with your instructor prior to working.
Location 1 _____________________ AQI ____________
8a. What is the primary pollutant contributing to the AQI?
8b. The color of the clouds in the Air Quality Forecast area (slightly down the page) match the colors of the AQI. How is AQI forecasted to change over the next few days, in comparison to its current value?
8c. What about this specific location may contribute to its AQI? (hint: think about population, sources of pollution, general climate, etc.)
Location 2 _____________________ AQI ____________
8d. What is the primary pollutant contributing to the AQI?
8e. The color of the clouds in the Air Quality Forecast area (slightly down the page) match the colors of the AQI. How is AQI forecasted to change over the next few days, in comparison to its current value?
8f. What about this specific location may contribute to its AQI? (hint: think about population, sources of pollution, general climate, etc.)
Part 2 – Sampling Air Quality
Using the provided instruments, you will work as a team to measure levels of Particulate Matter (PM) at three near-by locations: in the classroom, in the atrium of DSC, outside in an open area. Fill out the tables below and answer the analysis questions.
9. Of the three locations (classroom, atrium, outside), which do you hypothesize to have the highest levels of PM? Why?
10. How could you test your hypothesis?
11. Fill out the tables below, based on your observations. Take 3 samples at each site and calculate an average for both PM 2.5 and PM 10.
PM 2.5
|
Site Location |
Sample 1 |
Sample 2 |
Sample 3 |
Average |
|
|
|
|
|
|
|
|
|
|
|
|
|
|
|
|
|
|
PM 10
|
Site Location |
Sample 1 |
Sample 2 |
Sample 3 |
Average |
|
|
|
|
|
|
|
|
|
|
|
|
|
|
|
|
|
|
12. Which site had the highest PM average? Was your hypothesis correct?
13. Which site had the most variation between the three PM samples?
14. Consider the outside observation. How does that compare to the PM value of the Omaha AQI values, (b) and (c)?
15. Why do you suspect our observed value in lab was (different/similar) to the value reported by AirNow?
