
8 Lab 8: Human Population Growth
Introduction
In 1798, Thomas Malthus published An Essay on the Principle of Population, where it was identified that the human population expansion was outpacing the production of food. Since then, human population has continued to grow, with advances medicine, sanitation, and food access driving down death rates and increasing life expectancy. Concurrently, the agricultural and industrial revolutions have allowed for rapid growth in the agricultural sector, increasing food production and transportation efficiency. Food can now be grown and safely shipped worldwide. However, the balancing-act of population and food is complex, and not spatially homogeneous across the world.
In today’s lab, we will be researching global and country-specific population growth and population dynamics. The objectives are:
- Document and analyze differences in population dynamics between developed and developing nations.
- Interpret population pyramids, speaking to the implications of different configurations.
- Calculate a rate of global population change.
Background Information/Further Reading
Population Growth Rates
Most countries are trying to reduce the population growth rate due to social and environmental pressures/costs. A population growth rate of zero indicates that the number of people coming into the country is the same as the number leaving. This could be from a combination of people being born, immigrating, dying, and emigrating. To achieve a population growth rate of zero, each couple in that country would need to have no more than two children (one child replacing the father, one child replacing the mother), while the number of people immigrating and emigrating would need to be equal. The rate of growth in developed nations has become more constant in recent years, with some starting to experience negative growth rates (declining population). Conversely, many developing nations are still growing exponentially.
Population Pyramids
Population pyramids are a graph which depicts the distribution of population within a specific region (city, state, country, etc.) by age and gender. It allows for a quick visualization of a specific population, but also serves as a means of indicating population growth likelihood, labor potential, and even potential political instability. The figure below highlights an example pyramid.
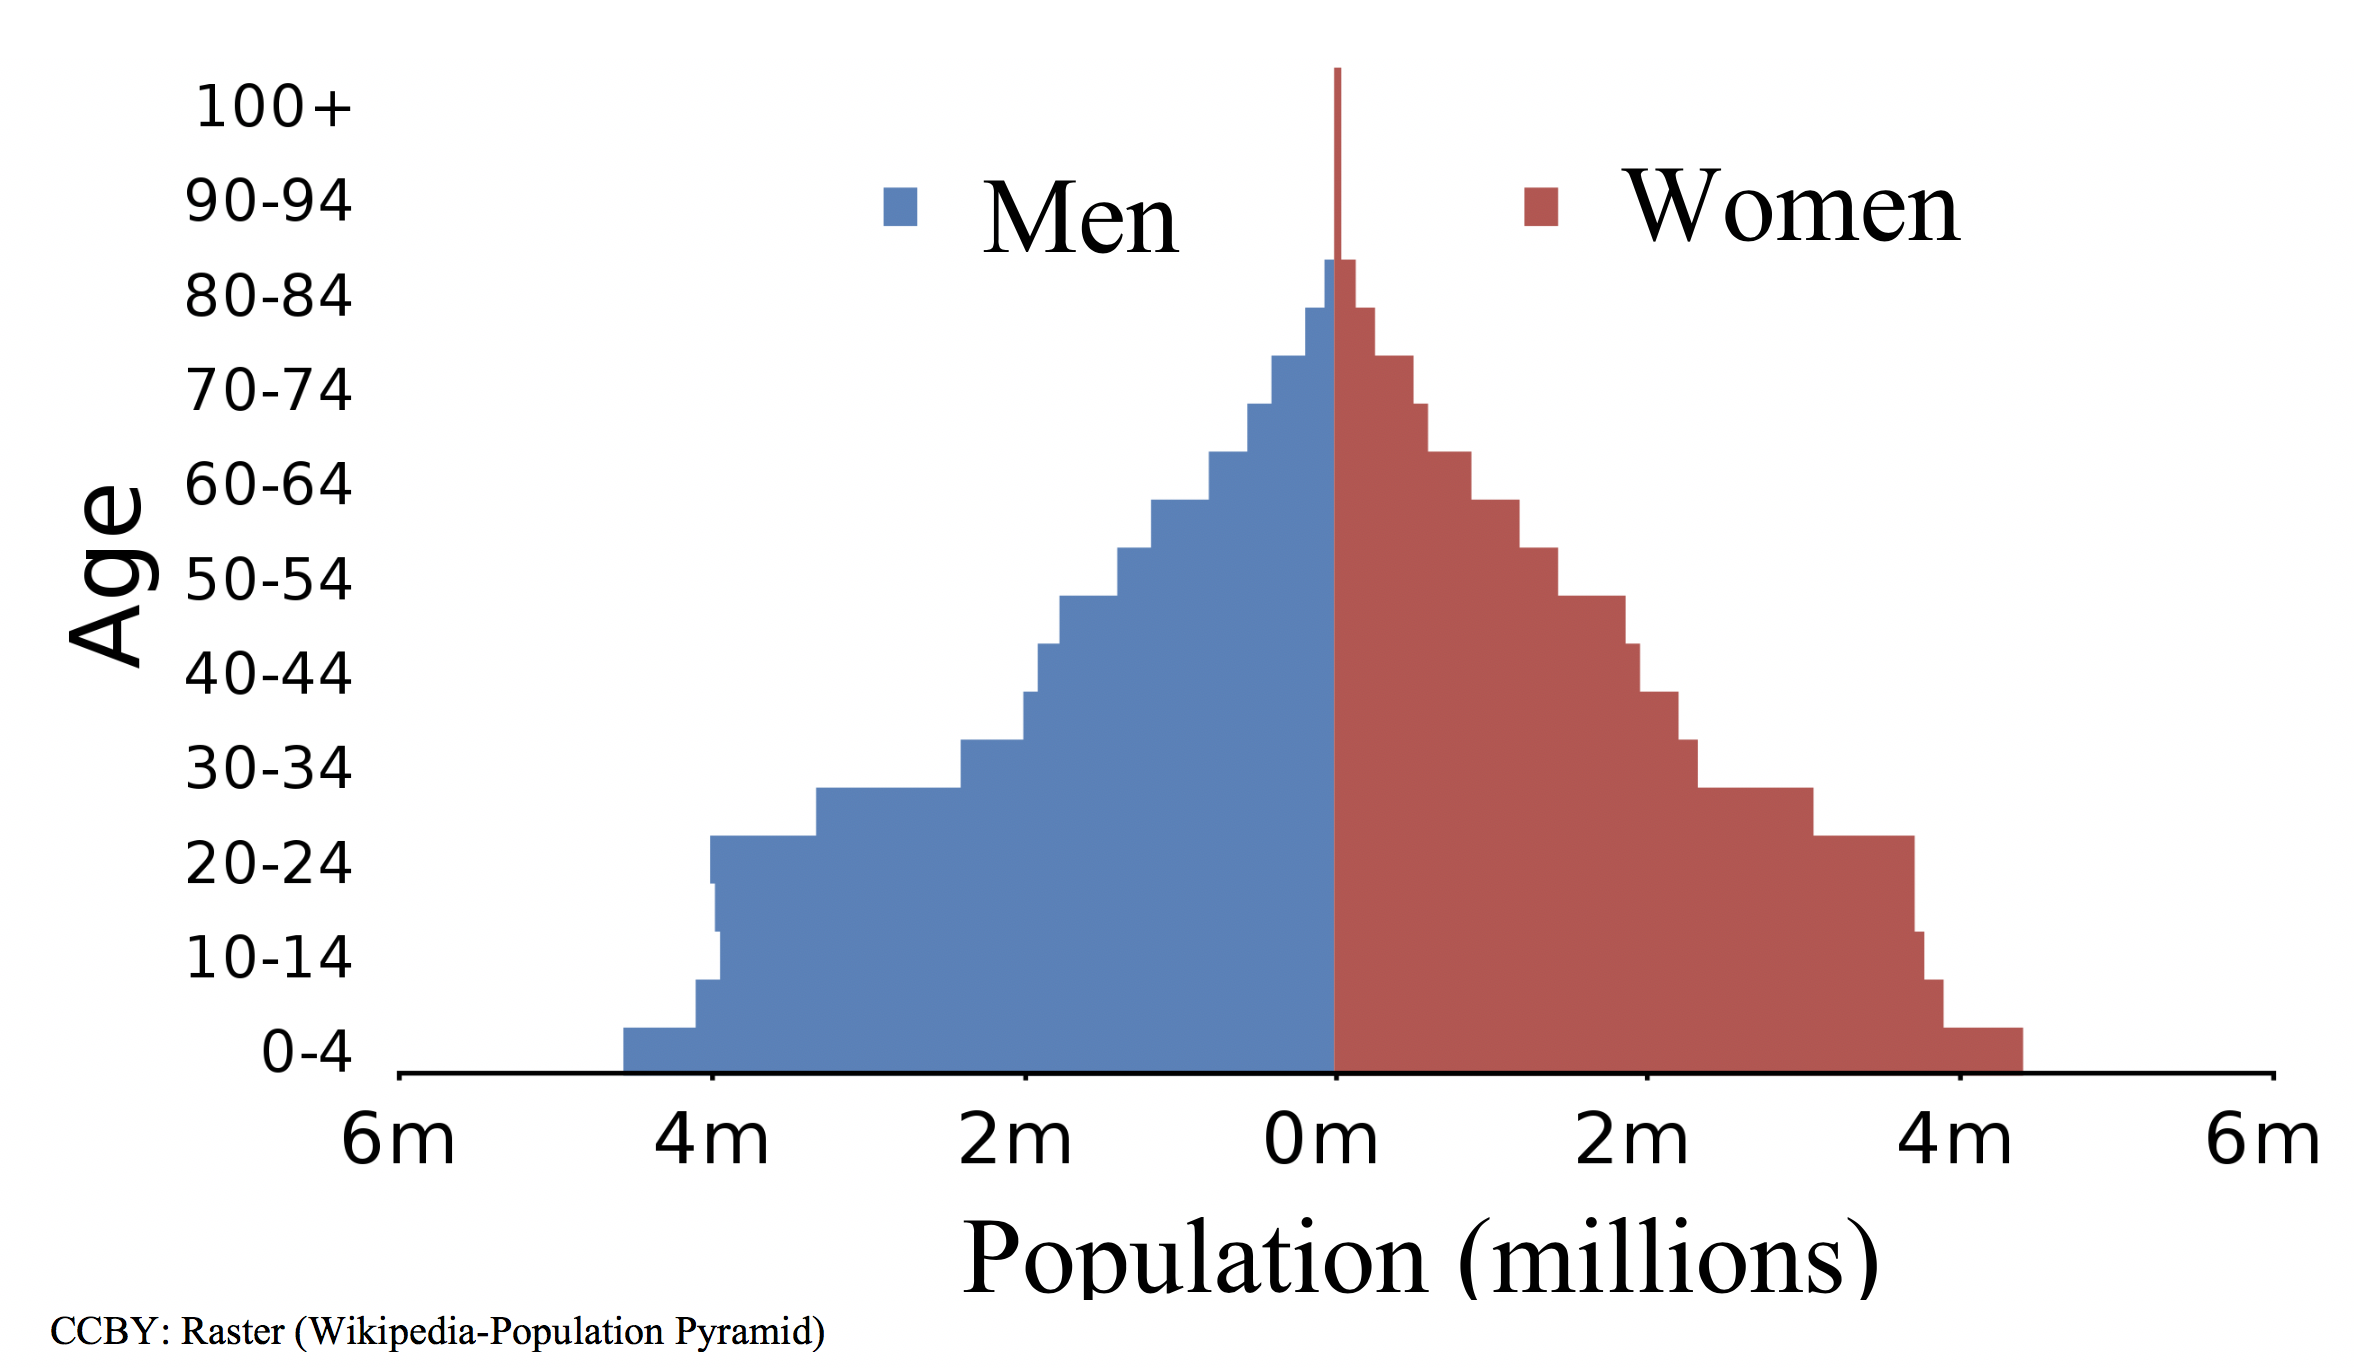
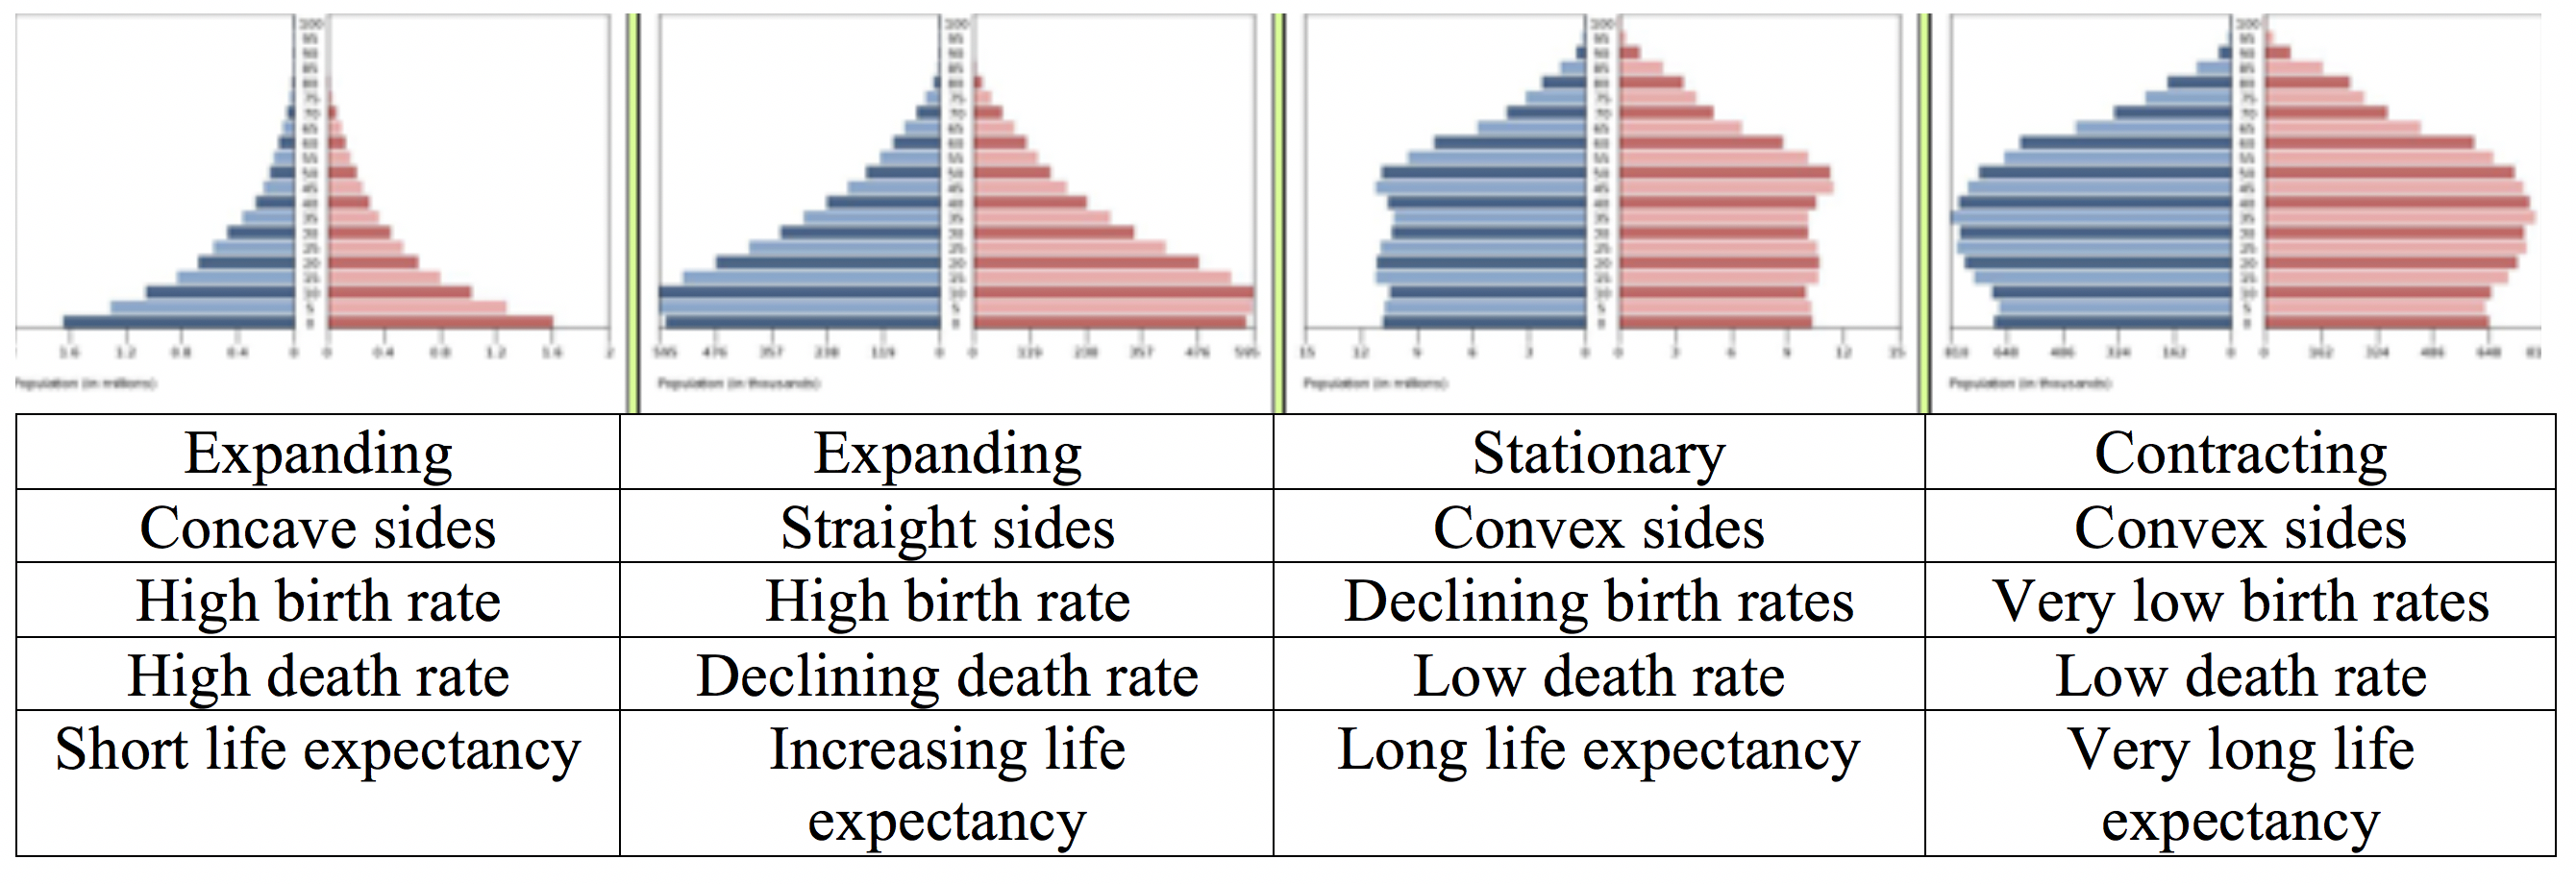
Along the y-axis, there are different age groups (e.g. 0-4, 10-14, etc.). The x-axis shows the magnitude of population, divided by gender. Zero is in the middle of the x-axis with positive numbers on both sides. Typically, women are on the right, men on the left, but this isn’t always the case. The further from the center line the bar is, the greater the population of that gendered-age-group. For example, there approximately 4.3 million women and 4.4 million men in the 0-4 age group, but about 2.0 million men and 2.2 million women in the 40-44 age group. In this case, a majority of the population is young people (as evident by the wider bars in the lower age groups), while the older population groups are much smaller. The shape can often look like a pyramid, hence the name. However different shapes imply different meanings, and we’ll showcase a few of those in this lab. Also keep in mind, these pyramids are not fixed. Over time, their shape and structure will change. Below, are examples of population pyramid shapes and indications on birth and death rates.
Note: some questions require you to calculate a percent change. As a reminder, the percent change formula is:
Percent Change = ((Final – Initial) / Initial ) x 100
Questions
Part 1. Global Population Dynamics Over Time
A table has been provided below showing the estimated global population, annually, based on January 1st. You’ll be using these data to calculate how population has changed over time.
|
Year |
Population |
Year |
Population |
Year |
Population |
|
1980 |
4,458,003,514 |
1994 |
5,663,150,427 |
2008 |
6,789,088,686 |
|
1981 |
4,536,996,762 |
1995 |
5,744,212,979 |
2009 |
6,872,767,093 |
|
1982 |
4,617,386,542 |
1996 |
5,824,891,951 |
2010 |
6,956,823,603 |
|
1983 |
4,699,569,304 |
1997 |
5,905,045,788 |
2011 |
7,041,194,301 |
|
1984 |
4,784,011,621 |
1998 |
5,984,793,942 |
2012 |
7,125,828,059 |
|
1985 |
4,870,921,740 |
1999 |
6,064,239,055 |
2013 |
7,210,581,976 |
|
1986 |
4,960,567,912 |
2000 |
6,143,493,823 |
2014 |
7,295,290,765 |
|
1987 |
5,052,522,147 |
2001 |
6,222,626,606 |
2015 |
7,379,797,139 |
|
1988 |
5,145,426,008 |
2002 |
6,301,773,188 |
2016 |
7,464,022,049 |
|
1989 |
5,237,441,558 |
2003 |
6,381,185,114 |
2017 |
7,547,858,925 |
|
1990 |
5,327,231,061 |
2004 |
6,461,159,389 |
2018 |
7,631,091,040 |
|
1991 |
5,414,289,444 |
2005 |
6,541,907,027 |
2019 |
7,713,468,100 |
|
1992 |
5,498,919,809 |
2006 |
6,623,517,833 |
2020 |
7,794,798,739 |
|
1993 |
5,581,597,546 |
2007 |
6,705,946,610 |
2021 |
7,874,965,825 |
1. What was the world population in the year you were born? If data is not available for your year on the table, please just select 1980.
2. What was the world population when you turned one year old? If data is not available for your year on the table, please just select 1981.
3. What was the change in world population during your first year of life?
4. What was the percent change in world population during your first year of life?
5. What was the change in population from this year to last year?
6. What is the percent change in population from this year to last year?
7. Compare your answers from questions 3-6. What is happening to world population? What is happening to the world population growth rate?
Part 2. Modeling Population Changes in the US
On January 1st, 2020, the U.S. population was 329,135,084. The population changes based on the following components:
(+) One birth: every 9 seconds
(–) One death: every 12 seconds
(+) Net migration: one every 47 seconds
8. Generate an equation to calculate how population in the US changes over time, using the components above.
9. Apply your equation to project what the US population would be on January 2nd, 2020. Hint: One day is 86,400 seconds. Be sure to show your work.
10. Apply your equation again, this time to project what the US population will be on January 1st, 2021, one year later. Be sure to show your work.
11. Using your answers to questions 8-10, calculate the percent change in population for the US specifically from Jan 1, 2020 to Jan 1 2021. Show your work. How does this compare to your answer in question 7, globally?
Part 3. Population Pyramids
Use the population pyramid and associated data provided, answer the following questions. When warranted, show your work. If you wish, countries other than those provided can be selected from the CIA’s website: https://www.cia.gov/library/publications/the-world-factbook/ Talk to your TA about the requirements.
12. Describe the shape of the population pyramid in the US. What does that mean for birth and death rates?
13. Would you describe the population of the US as expanding, stationary, or contracting? Why?
14. What percentage of the overall US population is female? What percentage is male?
15. Describe the shape of the population pyramid in Japan. What does that mean for birth and death rates?
16. Describe the shape of the population pyramid in Chad. What does that mean for birth and death rates?
17. What might the implications of the current population pyramids be for the future of these two countries (Japan and Chad)? Hint: think about availability of labor force, tax revenue, financial needs of children vs elderly, ratios of women to men, etc.
Essay
18. In your opinion, what is the most important implication of population growth to human-environment geography, or society in general? Be sure to note how and why this most important implication is ‘most important’.
