
1 Lab 1: Land Use/Land Cover Change
Introduction
In the subject of Geography, much of the information presented takes the form of maps. As such, being able to locate places, describe physical features, and assess changes over time are of critical importance. This first laboratory exercise is designed to acquaint you with basic map interpretation, through the perspective of land-use/land cover change, a reoccurring topic in lecture.
For today’s exercise, we will leverage the historical example of land cover change in the Hetch Hetchy Valley of California, along with the more localized change in Omaha, NE. The objectives of this lab are to:
- Become familiar with orienting on a map
- Further explore the historical decision to flood Hetch Hetchy Valley
- Approximate how land use/land cover has changed in Omaha, NE over the last century
- Contemplate the impact land use/land cover change has on the region
Background Information/Further Reading
Latitude and Longitude
Where are you right now? Most of the time, your answer to that question will be framed in the context of permanent and known locations: “I am next to the park off Harrison”, or “I’m two miles north of the Adams Park Community Center”, or “I’m at the intersection of Dodge and 72nd”. In these cases, this assumes everyone knows where those locations are. When we scale up from Omaha to the entire globe, we need fixed and known locations which can be referenced quickly to inform us where we are. This is where latitude and longitude come in.
Every 24 hours, the Earth rotates about its axis. This axis is a ‘line’ which passes through the center of the Earth, and intersects the fixed points of the North and South Poles. If we find every point on the Earth’s surface that is equidistant from these two poles, and connect the points, we would be drawing the circumference of the planet – called the equator. Our first (of two) units to inform our location is called latitude. Latitude is the distance a location is from the equator or from the pole. It is typically measured in degrees from the equator – a measure of the interior angle produced by a line extending from the desired location to the center of the earth to the equator (see figure 1.1). Thus, the North and South Poles are both 90° from the equator. To keep things from getting confusing and to differentiate between poles, the distinction N or S is added. Thus, the North Pole is at 90°N latitude, and the South Pole is at 90°S latitude, while the latitude of the equator (aka the angle of the equator from the equator) is 0°. Take Omaha, NE as an example. It is located at approximately 41°N latitude, and that angle can be seen in Figure 1.1.
The second measure is that of longitude. The second measure is necessary because there are many points on the planet that are 41°N of the equator, and we need a way to differentiate them. Longitude is the measure of distance east-west of an internationally-agreed line called the Prime Meridian – the line which extends from the North Pole to the South Pole, and passes through Greenwich, England. This line is called 0° longitude, and other locations are measured as the angular distance east or west of this line. Omaha is located 96° west of the Prime Meridian (Figure 1.1). Putting latitude and longitude together, we can provide a unique location for any point on the surface of the earth.
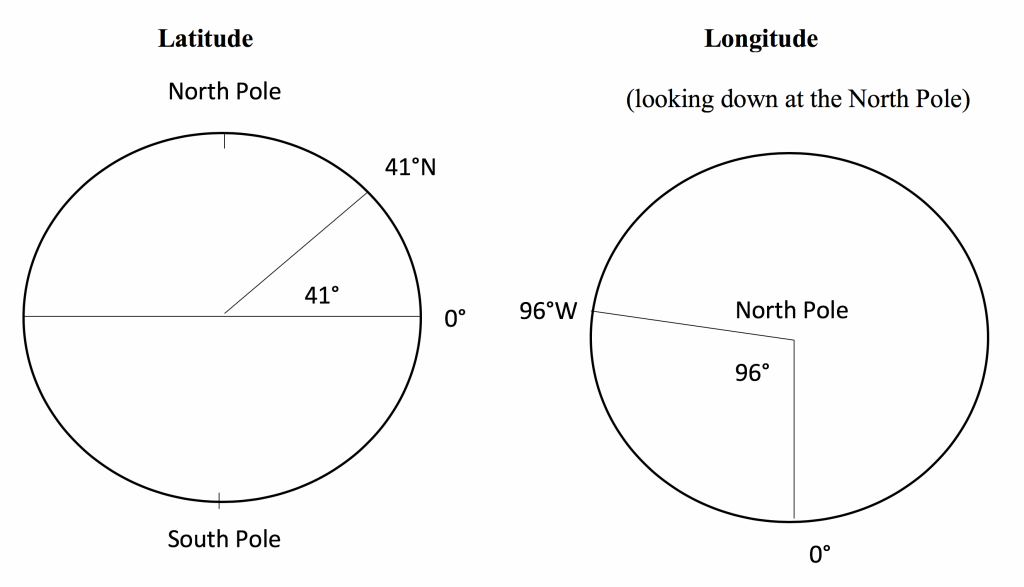
Figure 1.1. Omaha, NE is located at 41°N latitude and 96°W longitude.
Land Use/Land Cover
Land use and land cover are two of the most dominant ways in which people describe the environment. Land use denotes the activities taking place on the land surface, such as growing food, harvesting trees, or building cities. Land use shows how people use the landscape. Land cover, on the other hand, is the physical characteristics of the land surface. Is it covered by trees, concrete, soy beans, grass, water, etc. The decision to change land use/land cover from its natural (non-anthropogenic) state to something of benefit to society can have both positive and negative effects. Consider the example discussed in your textbook (Moseley) of Hetch Hetchy Valley in California (pg 18-25). In 1923, the O’Shaughnessy Dam was completed, and the Hetch Hetchy Valley was flooded to become a reservoir for supplying water to San Francisco’s consumption and sanitation needs. The decision to flood the valley led to the large and growing city having the resources it needed, but at a price, the ‘natural beauty’ of the valley, including its ecological diversity.
Land use cannot be directly determined by using areal or satellite imagery, however land cover can. Maps of land cover provide critical information to assist managers in understanding the current landscape, but also can be leveraged over time to evaluate past management/planning strategies, and gain insights into the possible impacts of current or pending land use/land cover change decisions. Such maps can be used to assess urban growth, model water and ecological quality, predict or assess impacts from floods, track sea-level rise, prioritize areas for conservation efforts, and compare impacts with various socioeconomic influences, a topic embedded in Environment Justice (later in the course).
Google Earth – App
To assist you in your investigation of land use/land cover changes, you will be using Google Earth in Part 1, followed by the Douglas County’s GIS website (https://www.dogis.org/Html5Viewer/?viewer=dogis) for Part 2. When using the Google Earth App, you can adjust your map style in the home tab (3 vertical lines). Starting with the “Exploration” or “Everything” settings is recommended. Under settings, have your units of measure be “meters and kilometers”, and latitude/longitude formatting in “Decimal”. Prior to coming to lab, you are welcome to play around with Google Earth (free download) to familiarize yourself with its features. This is freely available using the Google Chrome web browser. Visit https://www.google.com/earth/, and click “Launch” in the top right corner.
Within Google Earth App, you can use the latitude/longitude lines to find your location, or click on a spot to be given its location. You can also use the measuring tool (looks like a ruler) to determine linear distances between two points, or make a series of lines to find the area of a shape.
Questions
Part 1 – Hetch Hetchy Valley
1. Yosemite National Park is located in east-central California, east of San Francisco. Zoom to this region and find the Hetch Hetchy Valley (feel free to explore a bit). What is the lat/lon location of the middle of the O’Shaughnessy Dam?
_______________ Latitude ______________ Longitude
2. Taking advantage of the 3D visualization capacities of Google Earth, zoom in on the Hetch Hetchy Valley. Take note of what the valley looks like, qualitatively. The Yosemite Valley is located south-southeast of Hetch Hetchy. Take a look at this valley as well, keeping in mind the varying topography. Visually, besides the fact one is under water, how does the Hetch Hetchy valley compare to Yosemite?
3. As noted above, and in your textbook, the Hetch Hetchy Reservoir provides water to the San Francisco area. Currently, about 25% of San Francisco’s water comes from this reservoir (over 180 million gallons of water are consumed per day in S.F.). Using the measurement tool, about how far away is the reservoir from the city?
4. What do you think are some advantages and disadvantages to San Francisco using this particular water source?
5. Keeping in mind the discussion in lecture about conversation vs. preservation, visualizing the valley in Google Earth, and knowing the amount of water the reservoir has and continues to provide S.F., if you were in charge of the project, would you have authorized the building of the dam? Why or why not?
Part 2 – Omaha, NE
From the Douglas County GIS web portal (https://www.dogis.org/Html5Viewer/?viewer=dogis), find UNO’s Dodge St. Campus.
6. What is the location of Arts and Sciences Hall? (Hint: click and hold your cursor at the location)
_______________ Latitude ______________ Longitude
7. Under the “measure” tab on top, select the ‘Freehand Shape’ or ‘polygon’ icon. Use this to trace an approximate boarder around campus (Dodge St. campus only). What is the area and perimeter of campus? Use kilometers (km).
Perimeter _______________ Area _________________
8. The shape of campus should now be highlighted (in some fashion). Using the image, and your knowledge of campus, what are the different types of land cover you can see on campus? List them below.
9. Roughly, how much of campus (percentage) are those land cover types from the previous question? (example: land cover type of Lake: 70%)
10. On the bottom left on the website, there is an icon with a year on it (e.g. 2020). Click that icon and select ‘historical’. This allows you to scroll through a series of maps of the same location, dating back to the 1930s. In a couple sentences, describe what campus looked like in 1941? You can consult these photographs as well, if you wish (https://www.unomaha.edu/news/2015/07/dodge-campus-1938.php).
11. Quickly describe (1-2 sentences) what UNO’s campus looked like during the following years in comparison to the most current map:
1962:
1982:
2007:
12. Qualitatively, how has the land cover of campus changed over time?
13. Clear your campus outline shapes (using the ‘erase’ tool), unselect the ‘historical’ icon – going back to 2020, and zoom out to all of Omaha. On the left side, in the ‘layers’ area, you will find a checkable icon that says “City Boundaries”. By selecting it, a yellow boundary line will appear around Omaha’s official boarders. Using the ‘measure’ tool again as in #8, roughly map out the current outer limits of Omaha. Don’t spend a lot of time being super precise, just a rough cut is sufficient. Again, use km.
Perimeter _______________ Area _________________
14. What sorts of land cover types are most prominent within this region? Limit your answer to the 5 or so most common types.
15. Conduct a similar measurement of Omaha during the years 1941 and 1982. Note there are not official city boundaries during these years, you will need to approximate the boarders based on the land cover. To estimating this, typically cities’ formal boundaries end at the outer limit of developed land. While measuring these, take a note of land cover types and the relative percentages of the total.
1941: Perimeter _______________ Area _________________
1982: Perimeter _______________ Area _________________
16. How has the town grown over time, in area, from 1941 to now, and from 1982 to now, in terms of a percent change? Show your work. A ‘percent change’ is calculated using the following equation:

where ‘final’ is the most recent area (i.e. now – question 13),
and ‘initial’ is the area in the past (i.e. 1941 and/or 1982 – question 15).
1941-to-now:
1982-to-now:
17. What sorts of impacts might the growth and land cover change of Omaha had on the environment?
18. What sorts of impacts might the growth and land cover change of Omaha had on its inhabitants?
19. Seeing how land cover change and growth occurred, and perhaps coupled with your prior knowledge of town, how might have you changed the development of town for the better?
